Fargo Real Estate Market Update
M Re-Intel™ — Fargo-Moorhead real estate market report with live months of supply, days on market, price trends, hottest neighborhoods & monthly commentary by Jim Christl and Shannon Barnum. Live, hourly and weekly data from NorthstarMLS.
Your Fargo-Moorhead real estate market update: housing market stats, home prices, days on market and price trends across the metro and Minnesota lake country, straight from NorthstarMLS. Some sections are live, some refresh hourly or weekly, and each one shows its date.
Updated 10/13/2026, 12:00 AM CDT from NorthstarMLS
Is Fargo Real Estate a Buyer’s or Seller’s Market?
Right now, Fargo real estate is a seller’s market, just barely. The Market Heat Index™ reads 68 out of 100 — running hot, based on active inventory and homes sold in the last 90 days across the Fargo-Moorhead metro — Fargo, West Fargo, Moorhead, and Horace (residential only). Homes are selling close to asking, so sellers have the edge overall. At 3.9 months of supply, it’s just under the 4-month line where a balanced market starts. City by city: West Fargo 2.4 months (strong seller’s) · Fargo 4.0 (balanced) · Moorhead 4.1 (balanced) · Horace 6.5 (buyer’s).
- Months of supply: At today’s pace, every active Fargo-Moorhead listing would sell in about 3.9 months; under 4 months is a seller’s market.
- Asking price vs. sale price: Homes typically close at full asking price, and 58% sell for asking or more.
- Median time to sell: 64 days. From listing to sale, for Fargo-Moorhead homes sold in the last 90 days.
Months of supply decides the verdict: under 4 months is a seller’s market (under 2.5, a strong one), 4 to 6 months is balanced, and over 6 months is a buyer’s market. The Market Heat Index™ folds in two more signals, how close to asking homes sell and how fast, for one 0-to-100 temperature. Each month Jim & Shannon add a first-hand read on what the numbers feel like on the ground.
City housing market reports, updated monthly: Fargo, ND · West Fargo, ND · Moorhead, MN · Horace, ND
Fargo-Moorhead Housing Market Report
M Re-Intel™ is Modern Market REALTORS®’ monthly market intelligence brief for the Fargo-Moorhead metro and Minnesota lake country — a first-hand read on inventory, pricing, and pace from REALTORS® Jim Christl and Shannon Barnum, backed by live NorthstarMLS data.
October 2026 · Jim Christl & Shannon Barnum
Fargo-Moorhead
The house didn't get more expensive this fall. The money did. On September 3 a 30-year mortgage cost 6.71 percent; by October 8 Freddie Mac had it at 7.40 percent, the highest in nearly three years, after the Federal Reserve's first rate increase since 2023 and a 10-year Treasury that pushed past 5 percent. On a $325,000 home, September's median metro sale, that's about $120 more a month in principal and interest than five weeks earlier, and nearly $200 more than a year ago, with 20 percent down. You might expect buyers to flinch. Instead they did something smarter: they stopped shopping for a house and started shopping for a payment. The listings piled up, 987 homes for sale, up from the low 800s in August, with Fargo alone adding 12 percent in seven weeks, and 41 percent of everything on the market has already taken a price cut. Yet the homes that did sell in September sold as if nobody had told them: 100 percent of list price, about four weeks on the market, and 30 percent over asking, up from 24 percent a year ago. That isn't a falling market. It's a sorting one. Between $250,000 and $350,000 there are three months of supply, a seller's market by any measure; above $750,000 there are more than nine, a buyer's market by every measure. Redfin's numbers for the three months through August, measured their own way, sketch the same map. Fargo's median sale price slipped 3.1 percent to $315,000, while West Fargo's rose by exactly the same 3.1 percent, to $366,000, and West Fargo is still the tightest town in the metro, with 29 percent of its listings under contract. Moorhead posted the fastest gain of all, up 8.9 percent to $294,000, even as its homes now take 34 days to sell instead of 29 and nearly half its listings have cut. The rule of the season fits in one line: price it to the payment and it moves; price it to last spring and it waits.
New Construction
Want proof that this market now runs on the payment? Watch what the builders discount. New construction across the metro is sitting on 8.1 months of supply, more than double resale's 3.5. By the usual logic, that's where the price cuts should be. They aren't. Only 21 percent of the 195 new builds for sale have trimmed their price, against 46 percent of resale homes. Builders aren't lowering the house. They're lowering the money. One in five new-build listings now advertises a rate buydown or a buyer incentive (one current package lets buyers pick two of three: $10,000 toward the rate, $10,000 toward closing costs, or $20,000 in upgrades), and two dozen homes advertise a 4.99 percent mortgage. On the $484,900 new-build median, that's about $600 a month less, with 20 percent down, than borrowing at 7.40 percent. A resale seller could, in principle, play the same card through concessions; in practice, only 4 percent of resale listings so much as mention one. Builders have margin and volume to spend, and right now they're spending both on the monthly payment. They have company: nationally, two-thirds of builders offered incentives in September, according to the National Association of Home Builders. The same arithmetic keeps pulling new homes down-market. Thirty-nine percent of the 383 new builds across our service area list under $400,000, and the twelve new Moorhead permits Jordahl filed in early October carry values between $220,000 and $305,000. The leaderboard: Jordahl, 31 active homes; Thomsen, 25; Dabbert, 18; Brookstone, 16.
Lakes
If the metro is sorting by payment, lake country is sorting by shoreline, and the shoreline is winning. Waterfront homes that sold between May and September went for a $559,500 median, up 6.6 percent from last summer, on roughly a quarter more sales. Step back from the water and the story goes flat: the off-water median was $299,900, against $302,000 a year earlier. On asking prices the premium is 64 percent, $574,950 on the water and $349,900 off it. The reason is almost boringly simple. A builder can add houses and a lender can sweeten a rate, but nobody can add frontage. The season is closing on schedule: 1,554 homes are for sale, down from more than 1,600 a month ago, and new listings slowed to 386 in the past 30 days. What changed is the pace. September's lake sales spent a median 44 days on the market, up from 34 a year ago, so buyers who shop after the docks come out may find sellers more willing to talk. Leverage is uneven. Alexandria, Fergus Falls and Osakis are still moving, each with a fifth or more of its listings under contract. Detroit Lakes, with 146 homes for sale and just 9 percent spoken for, remains the buyer's counterweight. And Pelican Rapids, where 68 percent of listings sit on the water, asks a shoreline median of $825,000, a reminder that when the lake is the product, the calendar barely matters.
Written by Jim & Shannon from what we're seeing on the ground and in the MLS — not auto-generated.
Sources: Freddie Mac (30-year mortgage rates) · Federal Reserve (the Sept. 16 rate increase) · U.S. Treasury (10-year Treasury yields) · Redfin: Fargo, West Fargo, Moorhead (city sale prices and days on market, three months through August) · NAHB (builder incentives) · InForum (Moorhead building permits) · NorthstarMLS (every local listing and sales figure)
Hottest Neighborhoods Right Now
Where the most homes have sold in the last 90 days — one per metro city. A BuyPulse™ signal: “hottest” means the most sales, not the fastest, so each card shows its days to sell.
- Roosevelt / NDSU (Fargo) — 18 homes sold · last 90 days · 100% of asking · 56 days to sell
- The Wilds (West Fargo) — 22 homes sold · last 90 days · 100% of asking · 106 days to sell
- Village Green (Moorhead) — 18 homes sold · last 90 days · 100% of asking · 53 days to sell
- Cub Creek (Horace) — 15 homes sold · last 90 days · 100% of asking · 125 days to sell
Best Neighborhoods to Sell In Right Now
The Seller Opportunity Index ranks neighborhoods across the Fargo-Moorhead metro by how close to asking, and how fast, homes sold in the last 90 days. A neighborhood needs at least 5 sales to make the list.
- Parkview South (Fargo) — sold for 100% of asking in a median 32 days · 5 sold, last 90 days
- Southview Villages (Fargo) — sold for 100% of asking in a median 43 days · 7 sold, last 90 days
- Pointe West (Fargo) — sold for 100% of asking in a median 43 days · 5 sold, last 90 days
- West Fargo Investment (West Fargo) — sold for 101% of asking in a median 55 days · 5 sold, last 90 days
- Charleswood (West Fargo) — sold for 100% of asking in a median 49 days · 5 sold, last 90 days
Fastest-Selling Cities Right Now
A leaderboard of the fastest-selling cities among all 16 this page tracks, ranked by median days from listing to sale over the last 90 days. A quick way to see where homes move fastest across the Fargo-Moorhead metro and Minnesota lake country.
- Casselton — homes sold in a median 53 days · 14 sold, last 90 days
- Barnesville — homes sold in a median 55 days · 11 sold, last 90 days
- Walker — homes sold in a median 56 days · 30 sold, last 90 days
- Deer River — homes sold in a median 56 days · 21 sold, last 90 days
- Longville — homes sold in a median 56 days · 13 sold, last 90 days
- Fargo — homes sold in a median 60 days · 354 sold, last 90 days
- Moorhead — homes sold in a median 61 days · 154 sold, last 90 days
- Glyndon — homes sold in a median 64 days · 9 sold, last 90 days
Market Snapshot
Every active home for sale we track across Fargo-Moorhead and Minnesota lake country, priced at $88,000 or more. The cutoff keeps $1 auction placeholders and the cheapest as-is listings from skewing the averages.
Key metrics tracked: Active Listings count, Median Price, Average Price, Average Days on Market, Median Days on Market, Median Price per Square Foot, and Newest Listing date.
| Metric | Value |
|---|---|
| Active Listings | 3,766 |
| Median Price | $374,500 |
| Average Price | $483,371 |
| Average Days on Market | 93 days |
| Median Days on Market | 67 days |
| Median $/SqFt | $194 |
| Newest Listing | Oct 10, 2026 |
Price Reductions Right Now
A weekly count of homes with a current price cut in the cities this page tracks, the typical and biggest reduction, and which cities have the most cuts, plus the biggest price drops on the market right now. See every reduction on M Markdowns, our daily price-drop tracker.
- 531 homes with a price cut right now
- Typical reduction: $9,900
- Biggest reduction: $395,000
Most price cuts right now: Fargo (198), Moorhead (105), Detroit Lakes (69), West Fargo (51). See every reduction on M Markdowns.
Biggest price drops right now
The deepest price cuts in Fargo-Moorhead right now, by percentage off the previous asking price, one home per building.
- 505 OAK Street N, Unit 502, Fargo — 21% off · $252,684 less
- 4470 24th Avenue S, Unit 703, Fargo — 17% off · $100,000 less
- 410 MAIN Street, Hawley — 11% off · $5,000 less
- 1638 265th Street N, Hawley — 11% off · $25,000 less
- 109 2nd Avenue SW, Dilworth — 10% off · $15,000 less
- 7075 Benji Lane, Horace — 10% off · $40,100 less
Rare Finds in Fargo-Moorhead
Uncommon features in the metro right now, counted live off the active MLS feed.
- 53 with a pool — 5.8% of metro listings
- 15 on the water — 1.6% of metro listings
- 183 brand-new construction — 19.9% of metro listings
- 299 with a 3+ car garage — 32.5% of metro listings
Stats by City
Market data is tracked for 16 cities across the FM metro and Minnesota lake country:
- Fargo
- Moorhead
- West Fargo
- Horace
- Kindred
- Glyndon
- Mapleton
- Casselton
- Barnesville
- Dilworth
- Detroit Lakes
- Walker
- Cass Lake
- Deer River
- Longville
- Remer
Each city shows active listing count, median price, average days on market, and median price per square foot.
| City | Active | Median Price | Avg DOM | Median $/SqFt |
|---|---|---|---|---|
| Fargo | 466 | $386,450 | 103 | $178 |
| Moorhead | 216 | $319,900 | 70 | $155 |
| West Fargo | 111 | $390,000 | 67 | $180 |
| Horace | 124 | $421,344 | 111 | $202 |
| Kindred | 16 | $479,900 | 84 | $201 |
| Glyndon | 11 | $399,900 | 183 | $181 |
| Mapleton | 8 | $466,600 | 172 | $240 |
| Casselton | 10 | $296,950 | 63 | $156 |
| Barnesville | 24 | $369,950 | 92 | $159 |
| Dilworth | 24 | $379,500 | 87 | $195 |
| Detroit Lakes | 146 | $454,450 | 93 | $258 |
| Walker | 40 | $337,450 | 129 | $216 |
| Cass Lake | 26 | $369,450 | 146 | $236 |
| Deer River | 29 | $225,000 | 126 | $223 |
| Longville | 19 | $549,999 | 83 | $274 |
| Remer | 23 | $330,000 | 93 | $244 |
Hidden Gems — Best Value by City
The three cities where your dollar buys the most, ranked by median price per square foot, with how much less buyers pay per square foot than in Fargo.
- Moorhead — $155/sq ft — 13% less per sq ft than Fargo · median price $319,900
- Casselton — $156/sq ft — 12% less per sq ft than Fargo · median price $296,950
- Barnesville — $159/sq ft — 11% less per sq ft than Fargo · median price $369,950
Moorhead buyers pay about 13% less per square foot than in Fargo, and the median home costs 17% less ($319,900 vs. $386,450 in Fargo).
What $400K Buys You
The average living space — and typical bedroom/bathroom count — a $400,000 budget gets you in each Fargo-Moorhead city right now — a plain-English way to compare how far the same budget stretches from one city to the next.
- Barnesville — 2,722 sq ft · 5 bd · 3 ba
- Moorhead — 2,491 sq ft · 4 bd · 3 ba
- Glyndon — 2,314 sq ft · 4 bd · 3 ba
- West Fargo — 2,275 sq ft · 4 bd · 3 ba
- Fargo — 2,233 sq ft · 4 bd · 3 ba
- Detroit Lakes — 1,945 sq ft · 3 bd · 2 ba
- Horace — 1,944 sq ft · 3 bd · 3 ba
- Kindred — 1,861 sq ft · 3 bd · 2.5 ba
- Dilworth — 1,811 sq ft · 3 bd · 3 ba
Stats by Home Type
Market stats broken down by home type — residential, townhomes, condos, and more — each showing count, median price, and average square footage.
| Property Type | Active | Median Price | Avg SqFt |
|---|---|---|---|
| Single-family home | 3,315 | $384,900 | 2,154 |
| Townhome (side-by-side) | 139 | $364,900 | 1,800 |
| Twin home | 94 | $292,250 | 1,835 |
| Condo (low-rise) | 78 | $215,000 | 1,339 |
| Condo (high-rise) | 44 | $585,820 | 1,748 |
| Triplex | 18 | $262,500 | 2,599 |
| Duplex (up and down) | 18 | $216,000 | 2,136 |
| Fourplex | 17 | $309,000 | 3,802 |
| Townhome (four-corner) | 12 | $228,500 | 1,419 |
| Duplex (side-by-side) | 10 | $250,000 | 1,978 |
| Townhome (detached) | 9 | $359,900 | 1,729 |
| Condo (manor/village) | 3 | $144,000 | 1,137 |
| Apartment | 2 | $260,000 | 3,146 |
| Condo (two-unit) | 2 | $244,500 | 2,876 |
| Duplex (other) | 2 | $242,000 | 2,001 |
| Other | 2 | $447,500 | 4,114 |
| Condo (converted mansion) | 1 | $599,000 | 2,373 |
What Actually Sells a Home Faster
We analyzed median days to contract for single-family homes sold over the past 90 days across the Fargo-Moorhead metro. Some features really do help — others are surprisingly overrated.
- Finished basement: No faster. At all. (29 vs 29 days — dead even). Myth: “Buyers don't care about basements in summer.”
- 3-stall garage: No faster. At all. (28 vs 29 days — dead even) — myth busted. Myth: “A bigger garage guarantees a quicker sale.”
- Fireplace: Sells 4 days faster (26 vs 30 days median) — myth busted. Myth: “Fireplaces only matter in winter.”
- Built 2015 or newer: Sits 22 days longer (48 vs 26 days median) — myth busted. Myth: “Newer homes always sell the fastest.” See new construction homes →
Faster doesn’t always mean more valuable — a 3-stall garage may raise sale price even if it doesn’t cut days on market. This measures speed to contract only, among comparable local single-family homes.
Price Distribution
Active listings distributed across seven price ranges: Under $200K, $200K–$300K, $300K–$400K, $400K–$500K, $500K–$750K, $750K–$1M, and Over $1M.
| Price Range | Active Listings |
|---|---|
| Under $200K | 538 |
| $200K–$300K | 795 |
| $300K–$400K | 806 |
| $400K–$500K | 546 |
| $500K–$750K | 602 |
| $750K–$1M | 265 |
| Over $1M | 214 |
Fargo Housing Market FAQs
Is Fargo-Moorhead a buyer's or seller's market right now?
It comes down to months of supply, which this page reads live: under 4 months is a seller's market, 4 to 6 months is balanced, and over 6 months is a buyer's market. The verdict at the top shows the metro's figure and each city's own, since one city can run tighter or looser than the metro. The Market Heat Index beside it also weighs how fast homes sell and how close to asking they close, so it can read hotter or cooler than the verdict.
How hot is the Fargo real estate market right now?
Check the Market Heat Index at the top of this page — a 0-to-100 score that folds months of supply, sale-to-list ratio, and days on market into one live reading. Roughly 67 and up reads as running hot, the middle is steady, and under about 34 is cooling off.
How often is this Fargo housing market data updated?
It depends on the section, and each one shows its own date. The market temperature, rare finds and the just-listed homes are live, recalculated from NorthstarMLS when you load the page. The hottest-neighborhoods board, the Seller Opportunity Index and the what-sells-faster analysis refresh hourly. The weekly tables (Market Snapshot, price cuts, fastest-selling cities, stats by city and by home type, hidden gems, What $400K buys and the price distribution) refresh every Sunday. The M Re-Intel brief is written monthly by Jim & Shannon.
How often are North Dakota housing market reports updated?
Most housing market reports, from Realtor associations to national sites like Redfin and Zillow, publish monthly, and their figures usually trail the calendar by several weeks. This page runs on a faster clock for Fargo-Moorhead, North Dakota's largest metro: a live market temperature and live new listings, an hourly hottest-neighborhoods board, and weekly tables every Sunday, all from NorthstarMLS. For the read on what the numbers mean, the M Re-Intel brief comes out monthly.
What do these Fargo real estate statistics include?
The dashboard pulls together the housing statistics that matter for a decision: median and average prices, price per square foot, months of supply, average days on market, active price reductions, and neighborhood- and city-level breakdowns — a full read on the Fargo real estate market.
Where does this Fargo market data come from?
All of the real estate data here comes from NorthstarMLS as distributed by MLS Grid — the same source agents use — filtered to active, published listings and recent closed sales across Fargo-Moorhead and Minnesota lake country.
What is M Re-Intel?
M Re-Intel is Modern Market REALTORS®' monthly market intelligence brief — a first-hand read on inventory, pricing, and pace across Fargo-Moorhead and Minnesota lake country, written by REALTORS® Jim Christl and Shannon Barnum and backed by live NorthstarMLS data.
How is M Re-Intel different from the market stats?
The market stats dashboard shows the live numbers — median price, days on market, price distribution. M Re-Intel is the narrative layer: what those numbers mean right now, which pockets are hot, and what's actually moving.
How often is M Re-Intel updated?
Monthly. Jim & Shannon write a new brief each month based on what they're seeing in the field and in the MLS.
Who writes M Re-Intel?
Jim Christl and Shannon Barnum — the REALTORS® behind Modern Market REALTORS® in Fargo-Moorhead. Every brief is first-hand market observation, not auto-generated content.
Just Listed in Horace & West Fargo
The newest homes for sale in Horace and West Fargo: every one hit the MLS in the last 96 hours.
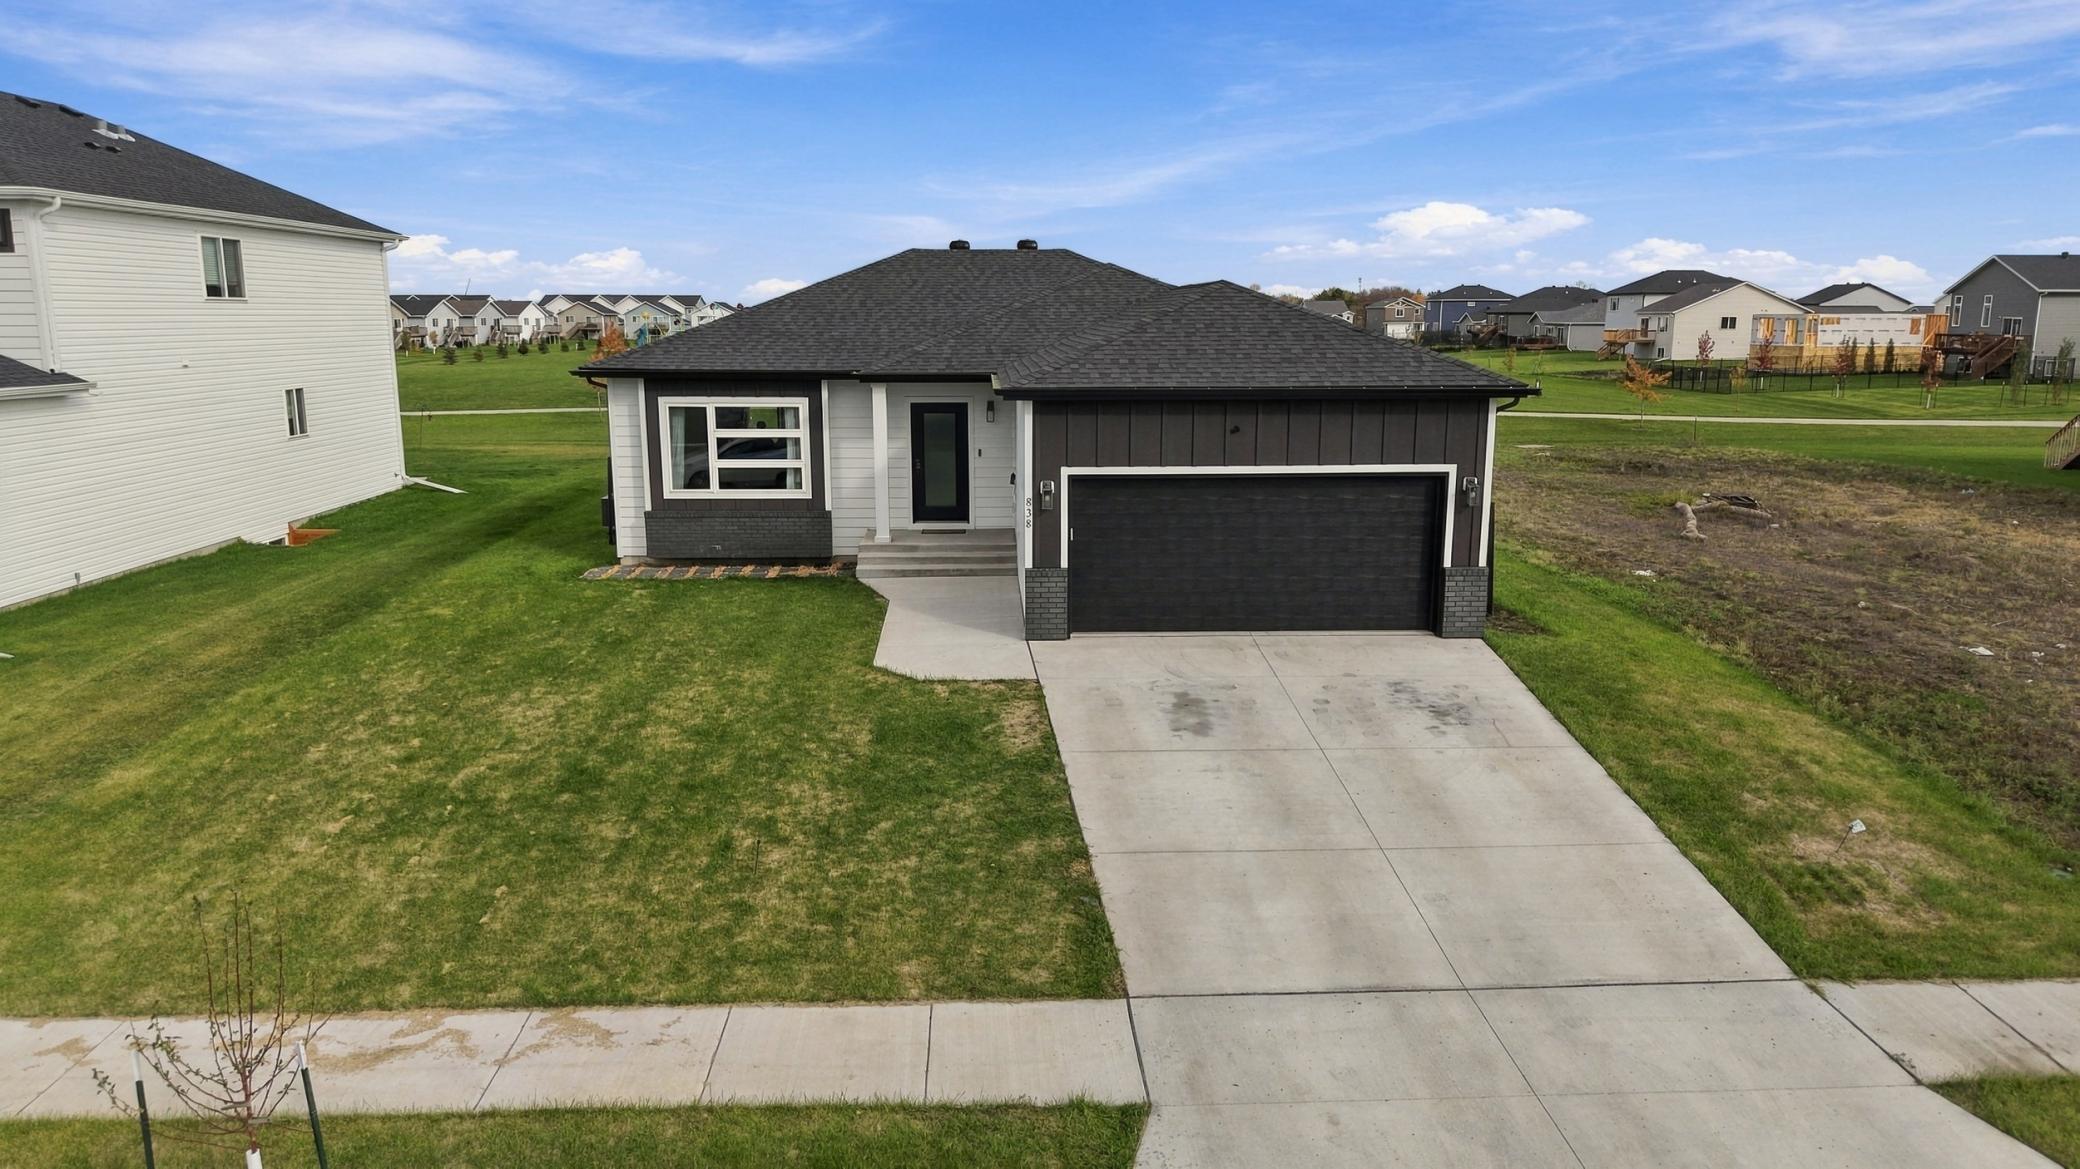 838 2nd Avenue, Horace, ND — $415,000 · Est. $2,098/mo · House for Sale · Rambler · 4 bed · 3 bath · 2,364 sqft · 0.214 ac lot · Active · M Premiere · Listed by Dakota Plains Realty
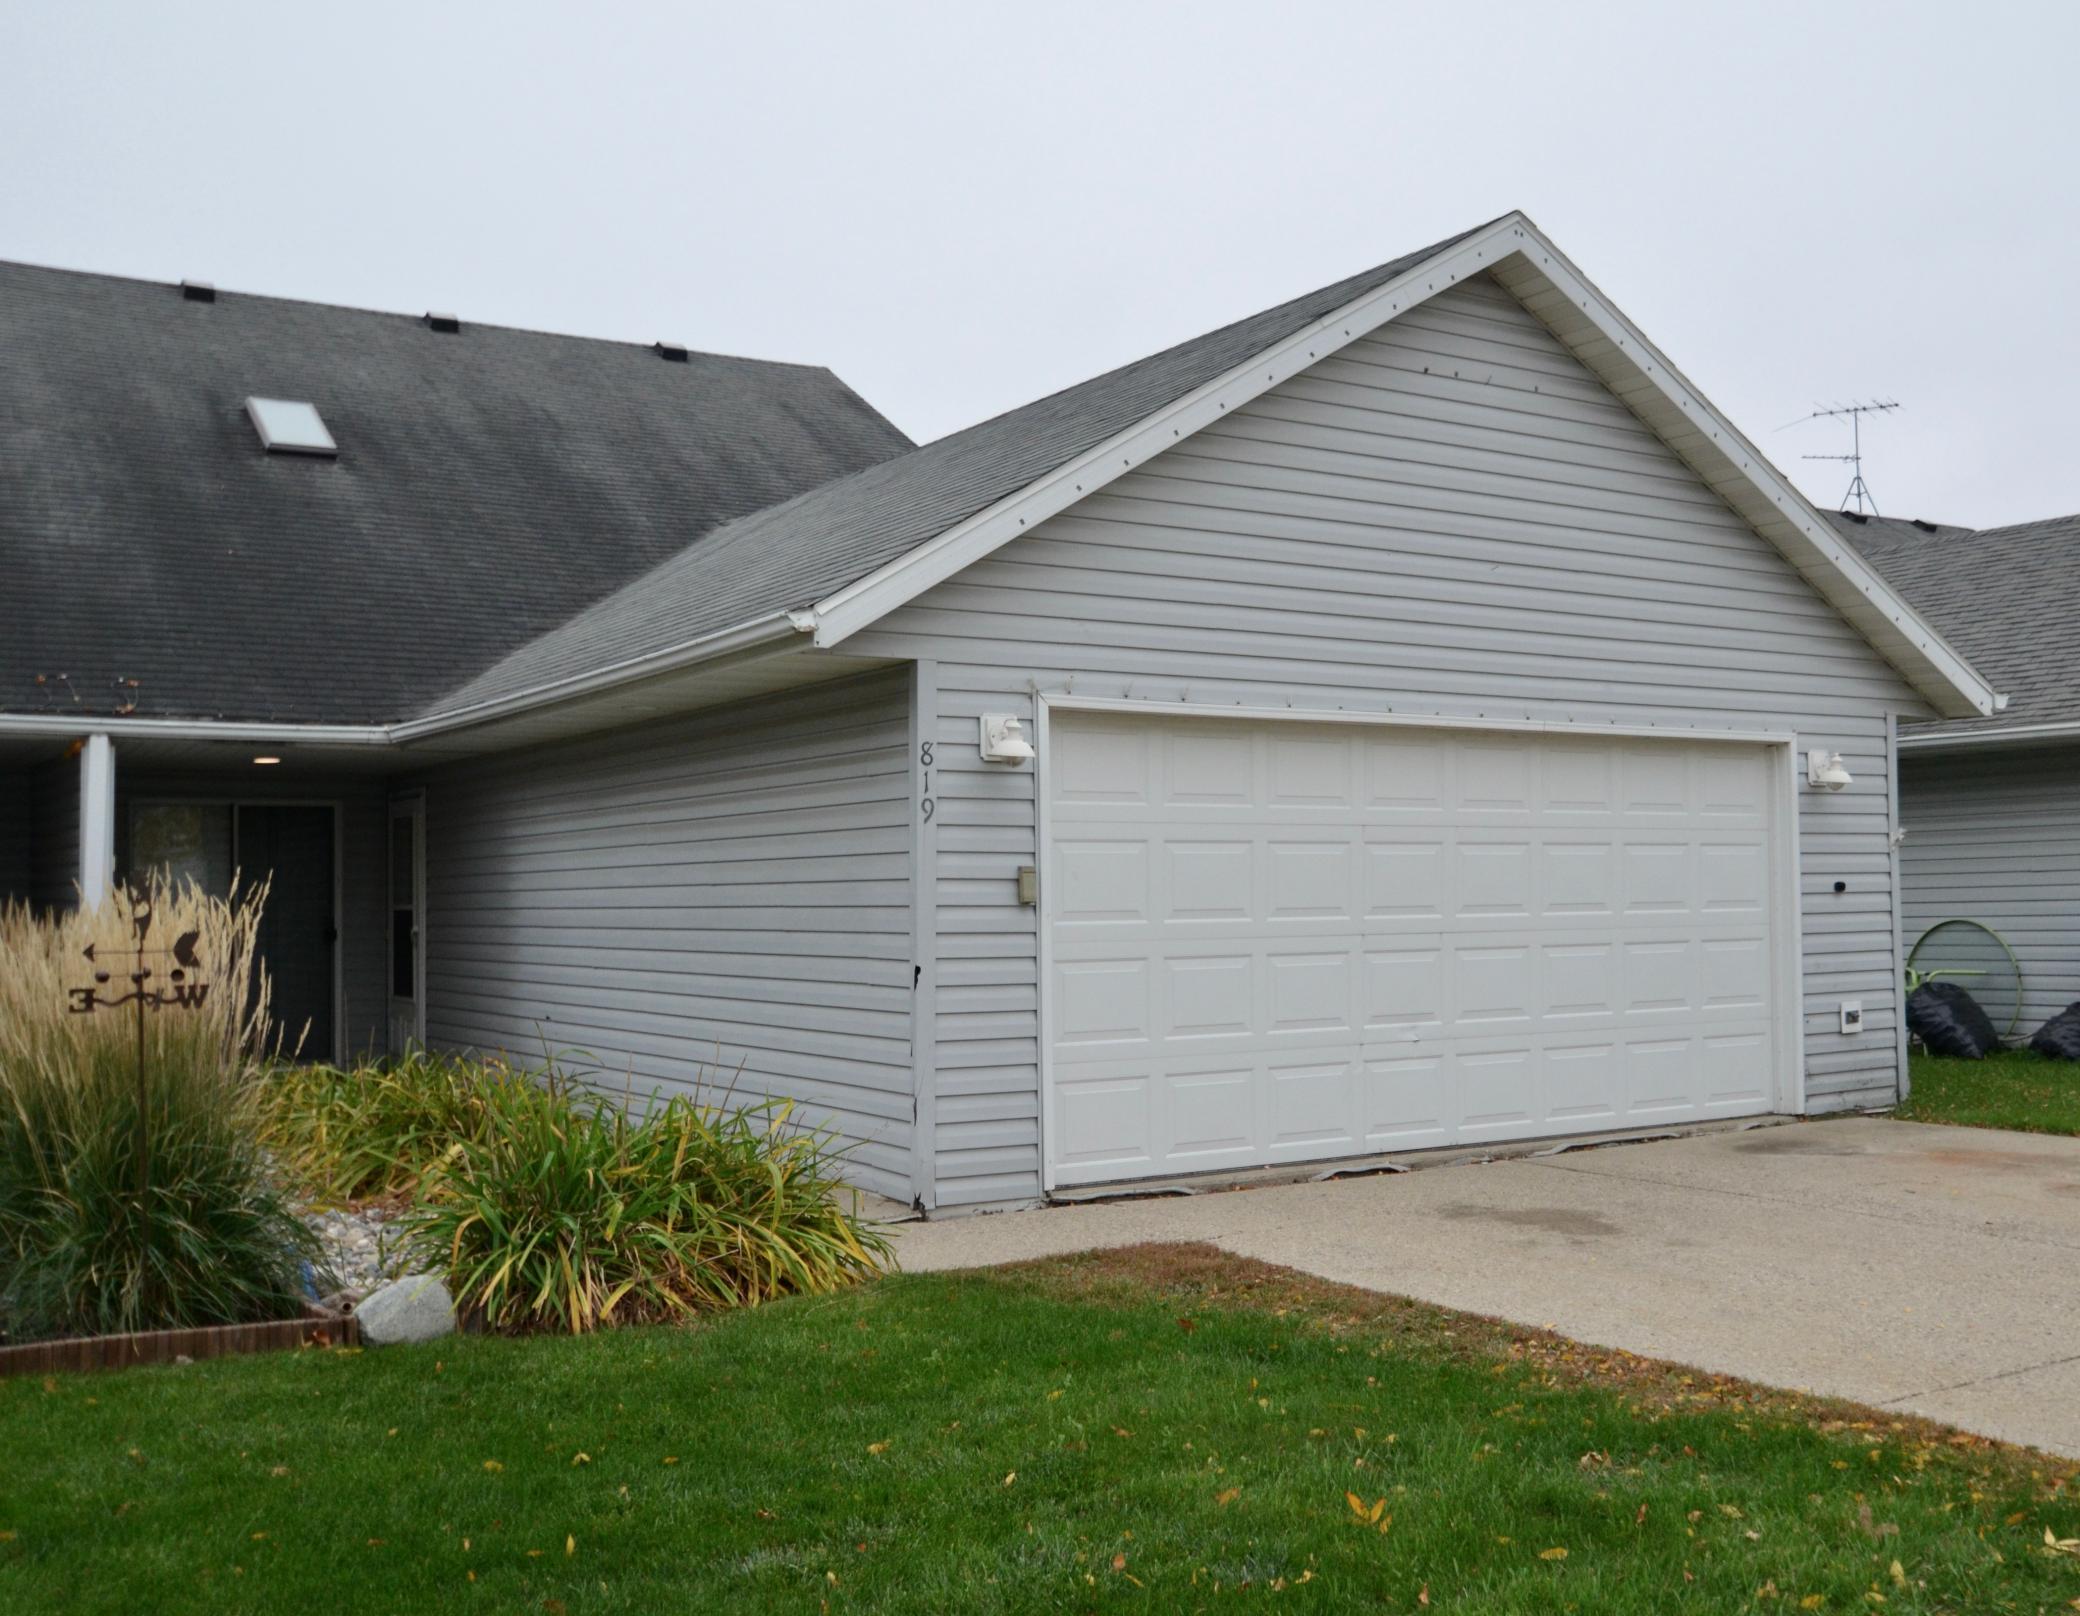 819 W 12 1/2 Avenue W, West Fargo, ND — $270,000 · Est. $1,365/mo · Twin Home for Sale · 4 bed · 2 bath · 192 sqft · 0.118 ac lot · Active · M Premiere · Listed by Berkshire Hathaway HomeServices Premier Properties
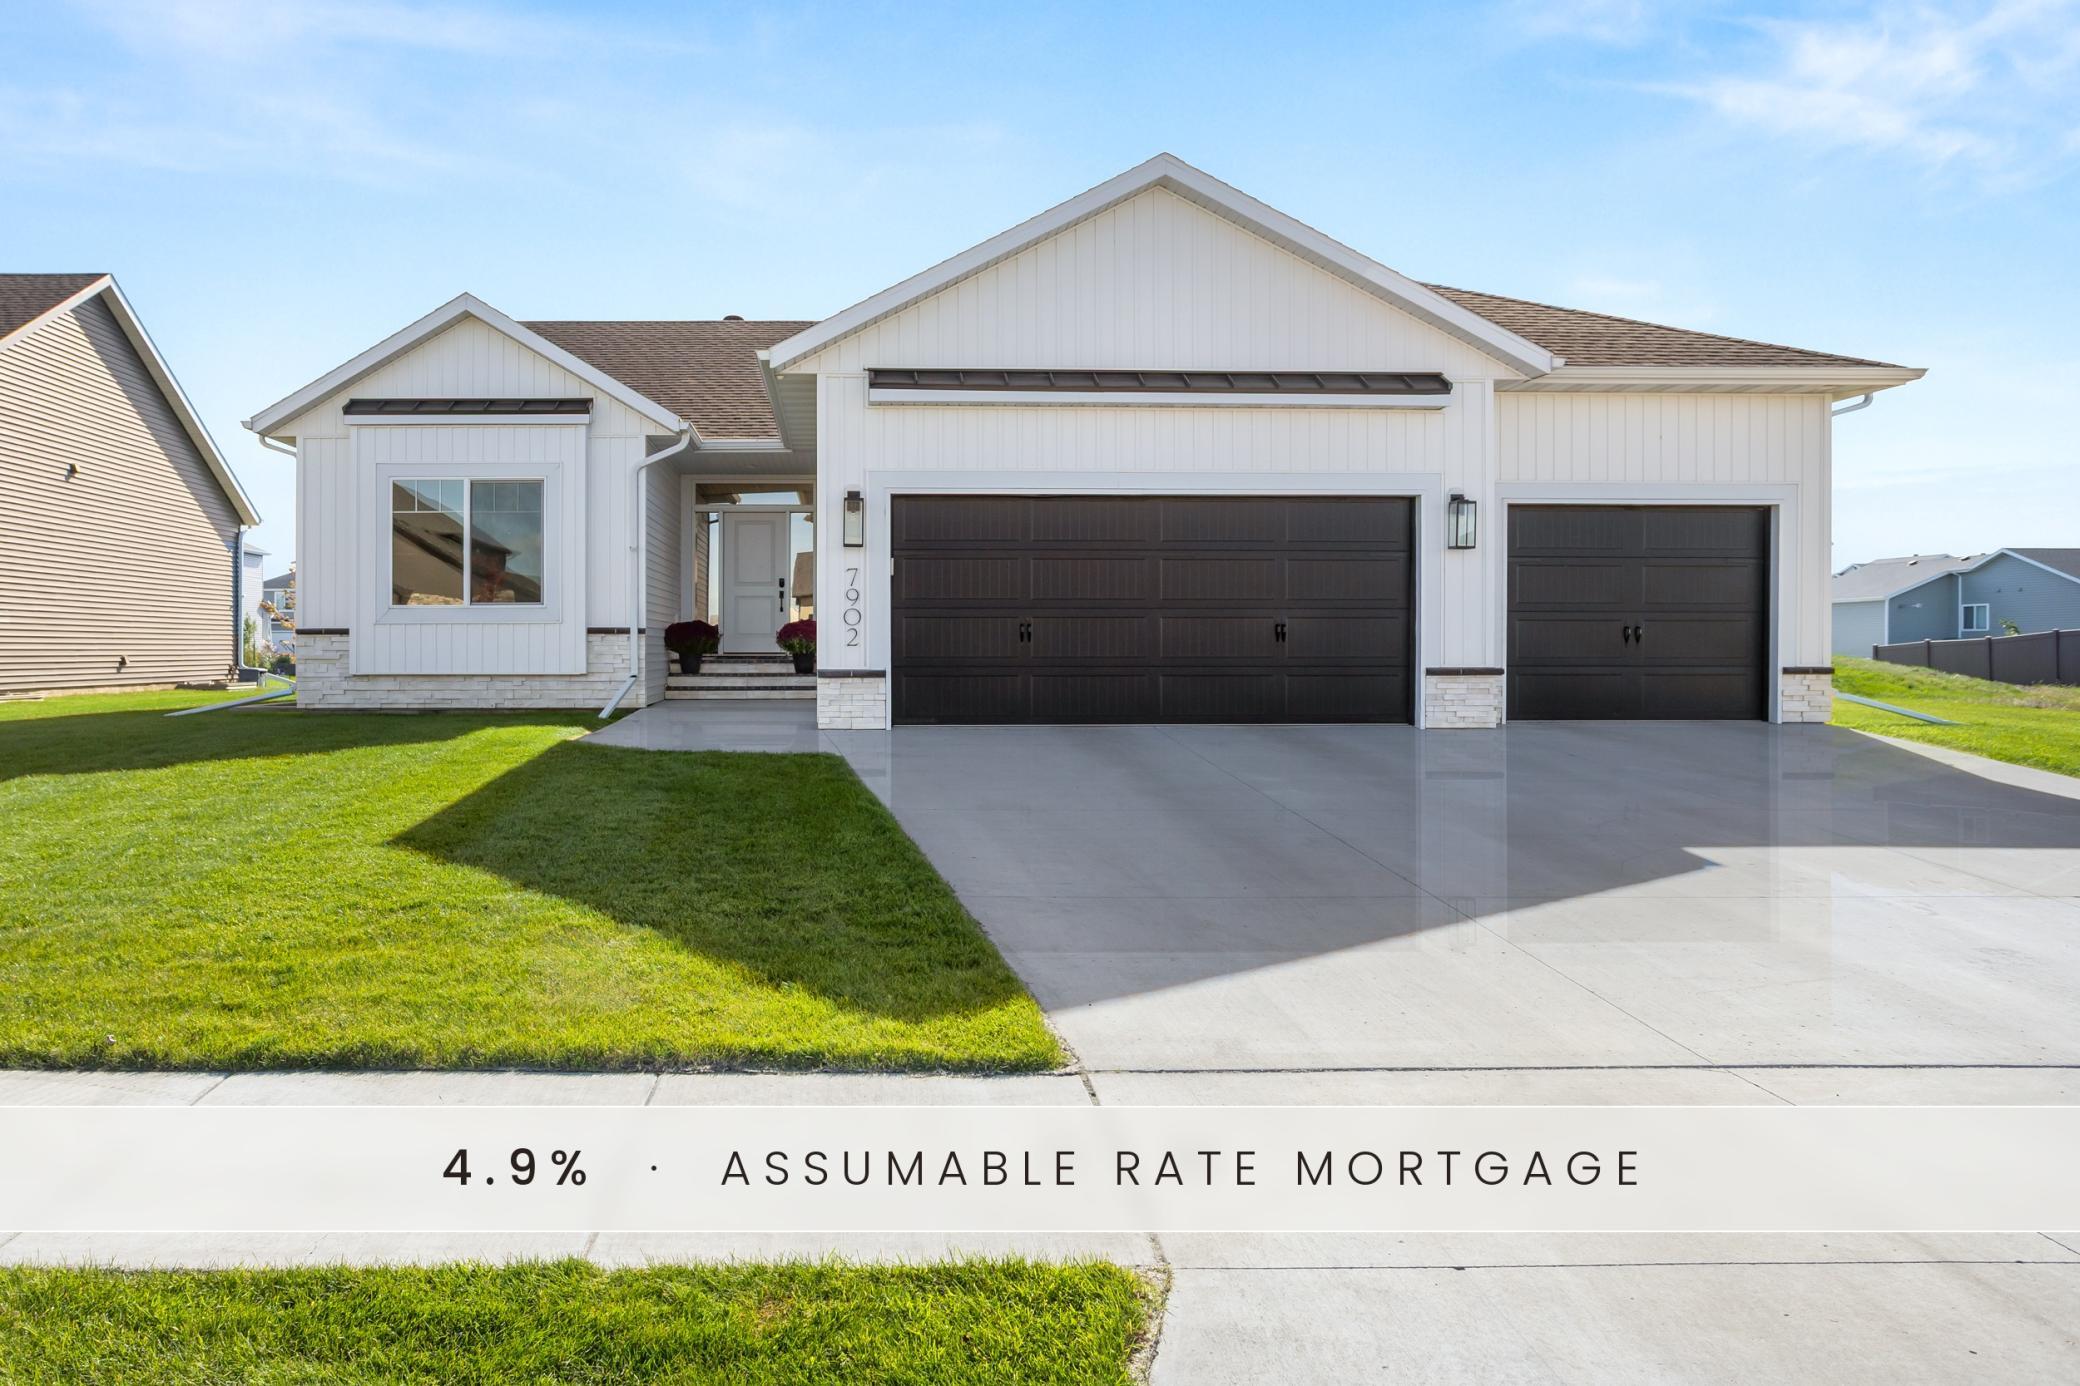 7902 Firefly Lane, Horace, ND — $695,000 · Est. $3,514/mo · House for Sale · Rambler · 5 bed · 3 bath · 3,488 sqft · 10,800 sqft lot · Active · M Premiere · Listed by Aspire Realty
What is M Re-Intel™?
M Re-Intel™ is Modern Market REALTORS®’ monthly market intelligence brief for the Fargo-Moorhead metro and Minnesota lake country — a first-hand read on inventory, pricing, and pace from REALTORS® Jim Christl and Shannon Barnum, backed by live NorthstarMLS data.
It's the one layer Zillow and Realtor.com structurally can't replicate — a local agent's first-hand read on where inventory is tight, what's selling fast, and what the numbers actually mean for your decision.
M Re-Intel™ vs. M Markdowns™: M Re-Intel is our monthly market narrative — the why behind the numbers; Market Stats is the live data dashboard — the what. Re-Intel gives you the read, Market Stats gives you the receipts.
Key features
- Written by Local Agents — Jim & Shannon write every brief from what they're seeing on the ground and in the MLS — not auto-generated from a national algorithm.
- Backed by Live Data — Every claim is anchored to real NorthstarMLS numbers — active inventory, pending ratios, median prices, and days on market — pulled fresh for each monthly brief.
- Three Market Zones — Fargo-Moorhead metro, new construction, and Minnesota lake country — each gets its own read because they move differently.
How to use it
- Monthly Check-In — Read the brief once a month to understand whether you're in a buyer's or seller's market and where the opportunities are.
- Pair With Live Stats — The brief sits on the Market Stats page alongside live data tables, price distribution, and the Market Heat Index — context plus numbers.
- Share With Clients — Link directly to the M Re-Intel section — it's a shareable, citable market read with your name on it.
Data sourced from NorthstarMLS as distributed by MLS GRID.
Search Listings | Buy a Home | Sell Your Home | Contact Us | Open Houses | Just Listed | Price Reduced
 Listings courtesy of NorthstarMLS as distributed by MLS GRID
Based on information submitted to the MLS GRID as of 10/13/2026, 12:00 AM CDT. All data is obtained from various sources and may not have been verified by broker or MLS GRID. Supplied Open House Information is subject to change without notice. All information should be independently reviewed and verified for accuracy. Properties may or may not be listed by the office/agent presenting the information.
IDX information is provided exclusively for consumers' personal, non-commercial use and may not be used for any purpose other than to identify prospective properties consumers may be interested in purchasing.
Modern Market REALTORS® — Jim Christl (Broker) & Shannon Barnum (Associate Broker). Serving Fargo, Moorhead, West Fargo, Horace, Detroit Lakes, and Minnesota lake country. Call (701) 205-5517.