Minnesota Real Estate Housing Market
The Minnesota real estate housing market by the numbers: whole-state listing data and home values, plus August through October 2026 closings from NorthstarMLS compared with the same months a year earlier. Updated monthly; this report ran November 2, 2026.
How’s the Minnesota Housing Market?
Across Minnesota, homes listed for a median $379,900 in September 2026, down 2.3% from a year earlier, and home values were up 3.0% over the year to the second quarter of 2026 (FHFA). From August through October 2026, northwest and central Minnesota homes sold for a median $310,000, about the same as a year earlier, after a median 44 days on the market. With 3.8 months of supply, northwest and central Minnesota is a seller’s market, just barely.
About a quarter of northwest and central Minnesota sales spent 16 days or fewer on the market, and 37% of those homes sold over the asking price. Another quarter spent 84 days or more; 9% of those sold over asking.
Minnesota Statewide Numbers
Across all of Minnesota in September 2026, homes listed for a median $379,900, down 2.3% from a year earlier, with 19,379 homes for sale and 7,746 new listings that month. Listings had been on the market a median 47 days, and 38% had a price cut. By FHFA’s house price index, Minnesota home values were up 3.0% over the year to the second quarter of 2026 and up 31.2% over five years.
- Median list price: $379,900 (−2.3% vs. a year earlier)
- Homes for sale: 19,379 (+30.0% vs. a year earlier)
- New listings: 7,746 (+2.4% vs. a year earlier)
- Median days listed: 47 (+2 days vs. a year earlier)
- Listings with a price cut: 38% (−1 pt vs. a year earlier)
- Home values, 1 year: +3.0% (+31.2% over 5 years)
Whole-state figures: Realtor.com listing data for September 2026 and the FHFA House Price Index (all transactions) for the second quarter of 2026, via FRED, the Federal Reserve Bank of St. Louis. Days listed counts how long the homes for sale have been on the market.
Minnesota Home Sales
- Median sale price: $310,000 (Same as a year earlier)
- Avg. sale price: $405,446 (+5.6% vs. a year earlier)
- Homes sold: 2,120 (−5.1% vs. a year earlier)
- Median days on market: 44 (+4 days vs. a year earlier)
- Avg. sale-to-list: 97.2% (−0.2 pts vs. a year earlier)
- Sold over asking: 21% (Same as a year earlier)
- Median price per sq ft: $179 (+0.6% vs. a year earlier)
Closed sales from August through October 2026, compared with August through October 2025. Days on market is NorthstarMLS's count for each closed sale; sale-to-list is the average of each sale price divided by its final list price.
These sales are NorthstarMLS closings in the part of Minnesota we track, Moorhead and the lake country (the most sales were in Crow Wing County, Otter Tail County, Cass County, and Itasca County). They do not include the Twin Cities, so their medians run below a figure for the whole state; the whole-state figures above cover all of Minnesota.
Is Minnesota a Buyer’s or Seller’s Market?
With 2,690 homes for sale on November 2, 2026 and 2,120 sold from August through October 2026, northwest and central Minnesota has 3.8 months of supply: a seller’s market. At 3.8 months of supply, it’s just under the 4-month line where a balanced market starts. Under 4 months is a seller’s market, 4 to 6 months is balanced, and over 6 months is a buyer’s market. 42% of the homes for sale in northwest and central Minnesota had a price cut.
Minnesota Months of Supply by Price
Months of supply for each price range: the homes for sale on the report date against the last three months of sales. The tighter the supply, the more a seller is in charge.
| Price range | For sale | Sold, 3 mo | Months of supply | Market |
|---|---|---|---|---|
| Under $250K | 734 | 725 | 3.0 | Seller’s |
| $250K–$350K | 558 | 515 | 3.3 | Seller’s |
| $350K–$500K | 656 | 408 | 4.8 | Balanced |
| $500K–$750K | 425 | 282 | 4.5 | Balanced |
| $750K and up | 317 | 190 | 5.0 | Balanced |
In northwest and central Minnesota, homes under $250K have the least supply (3.0 months) and homes at $750K and up the most (5.0 months).
Minnesota Housing Market by County
Crow Wing County had 365 of the 2,120 sales (17%), at a median $380,000.
Closed sales by county for the report’s three months (counties with at least 3), the median price against the same months a year earlier (shown when both had at least 20 sales), and the homes for sale on the report date.
| County | Homes sold | Median sale price | For sale |
|---|---|---|---|
| Crow Wing County | 365 | $380,000 (−1.3% vs. 2025) | 424 |
| Otter Tail County | 237 | $289,900 (−3.4% vs. 2025) | 311 |
| Cass County | 208 | $381,250 (+3.0% vs. 2025) | 199 |
| Itasca County | 181 | $270,000 (−6.9% vs. 2025) | 182 |
| Clay County | 180 | $291,000 (About flat vs. 2025) | 314 |
| Douglas County | 169 | $349,900 (−4.8% vs. 2025) | 157 |
| Beltrami County | 127 | $299,900 (+7.9% vs. 2025) | 162 |
| Hubbard County | 120 | $342,500 (−0.6% vs. 2025) | 136 |
| Becker County | 113 | $410,000 (+13.9% vs. 2025) | 204 |
| Aitkin County | 94 | $291,600 (About flat vs. 2025) | 116 |
| Todd County | 73 | $245,000 (+2.1% vs. 2025) | 91 |
| Pennington County | 40 | $168,250 (+4.3% vs. 2025) | 46 |
Minnesota vs. North Dakota
Minnesota’s median list price ($379,900) is higher than North Dakota’s ($370,700), and its home values grew slower over the year (3.0% vs. 4.7%).
| State | Median list price | Homes for sale | Median days listed | Home values, 1 yr | NorthstarMLS sale price |
|---|---|---|---|---|---|
| North Dakota | $370,700 (+1.7% in a year) | 2,278 | 57 | +4.7% | $332,000 |
| Minnesota | $379,900 (−2.3% in a year) | 19,379 | 47 | +3.0% | $310,000 |
Whole-state list prices, homes for sale and days listed are Realtor.com data for the same month; home values are FHFA’s index over a year; sale prices are NorthstarMLS closings in the part of each state it covers.
Homes for Sale in Minnesota
The newest homes for sale across Minnesota, Fargo-Moorhead area first, then the nearest towns, live from NorthstarMLS.
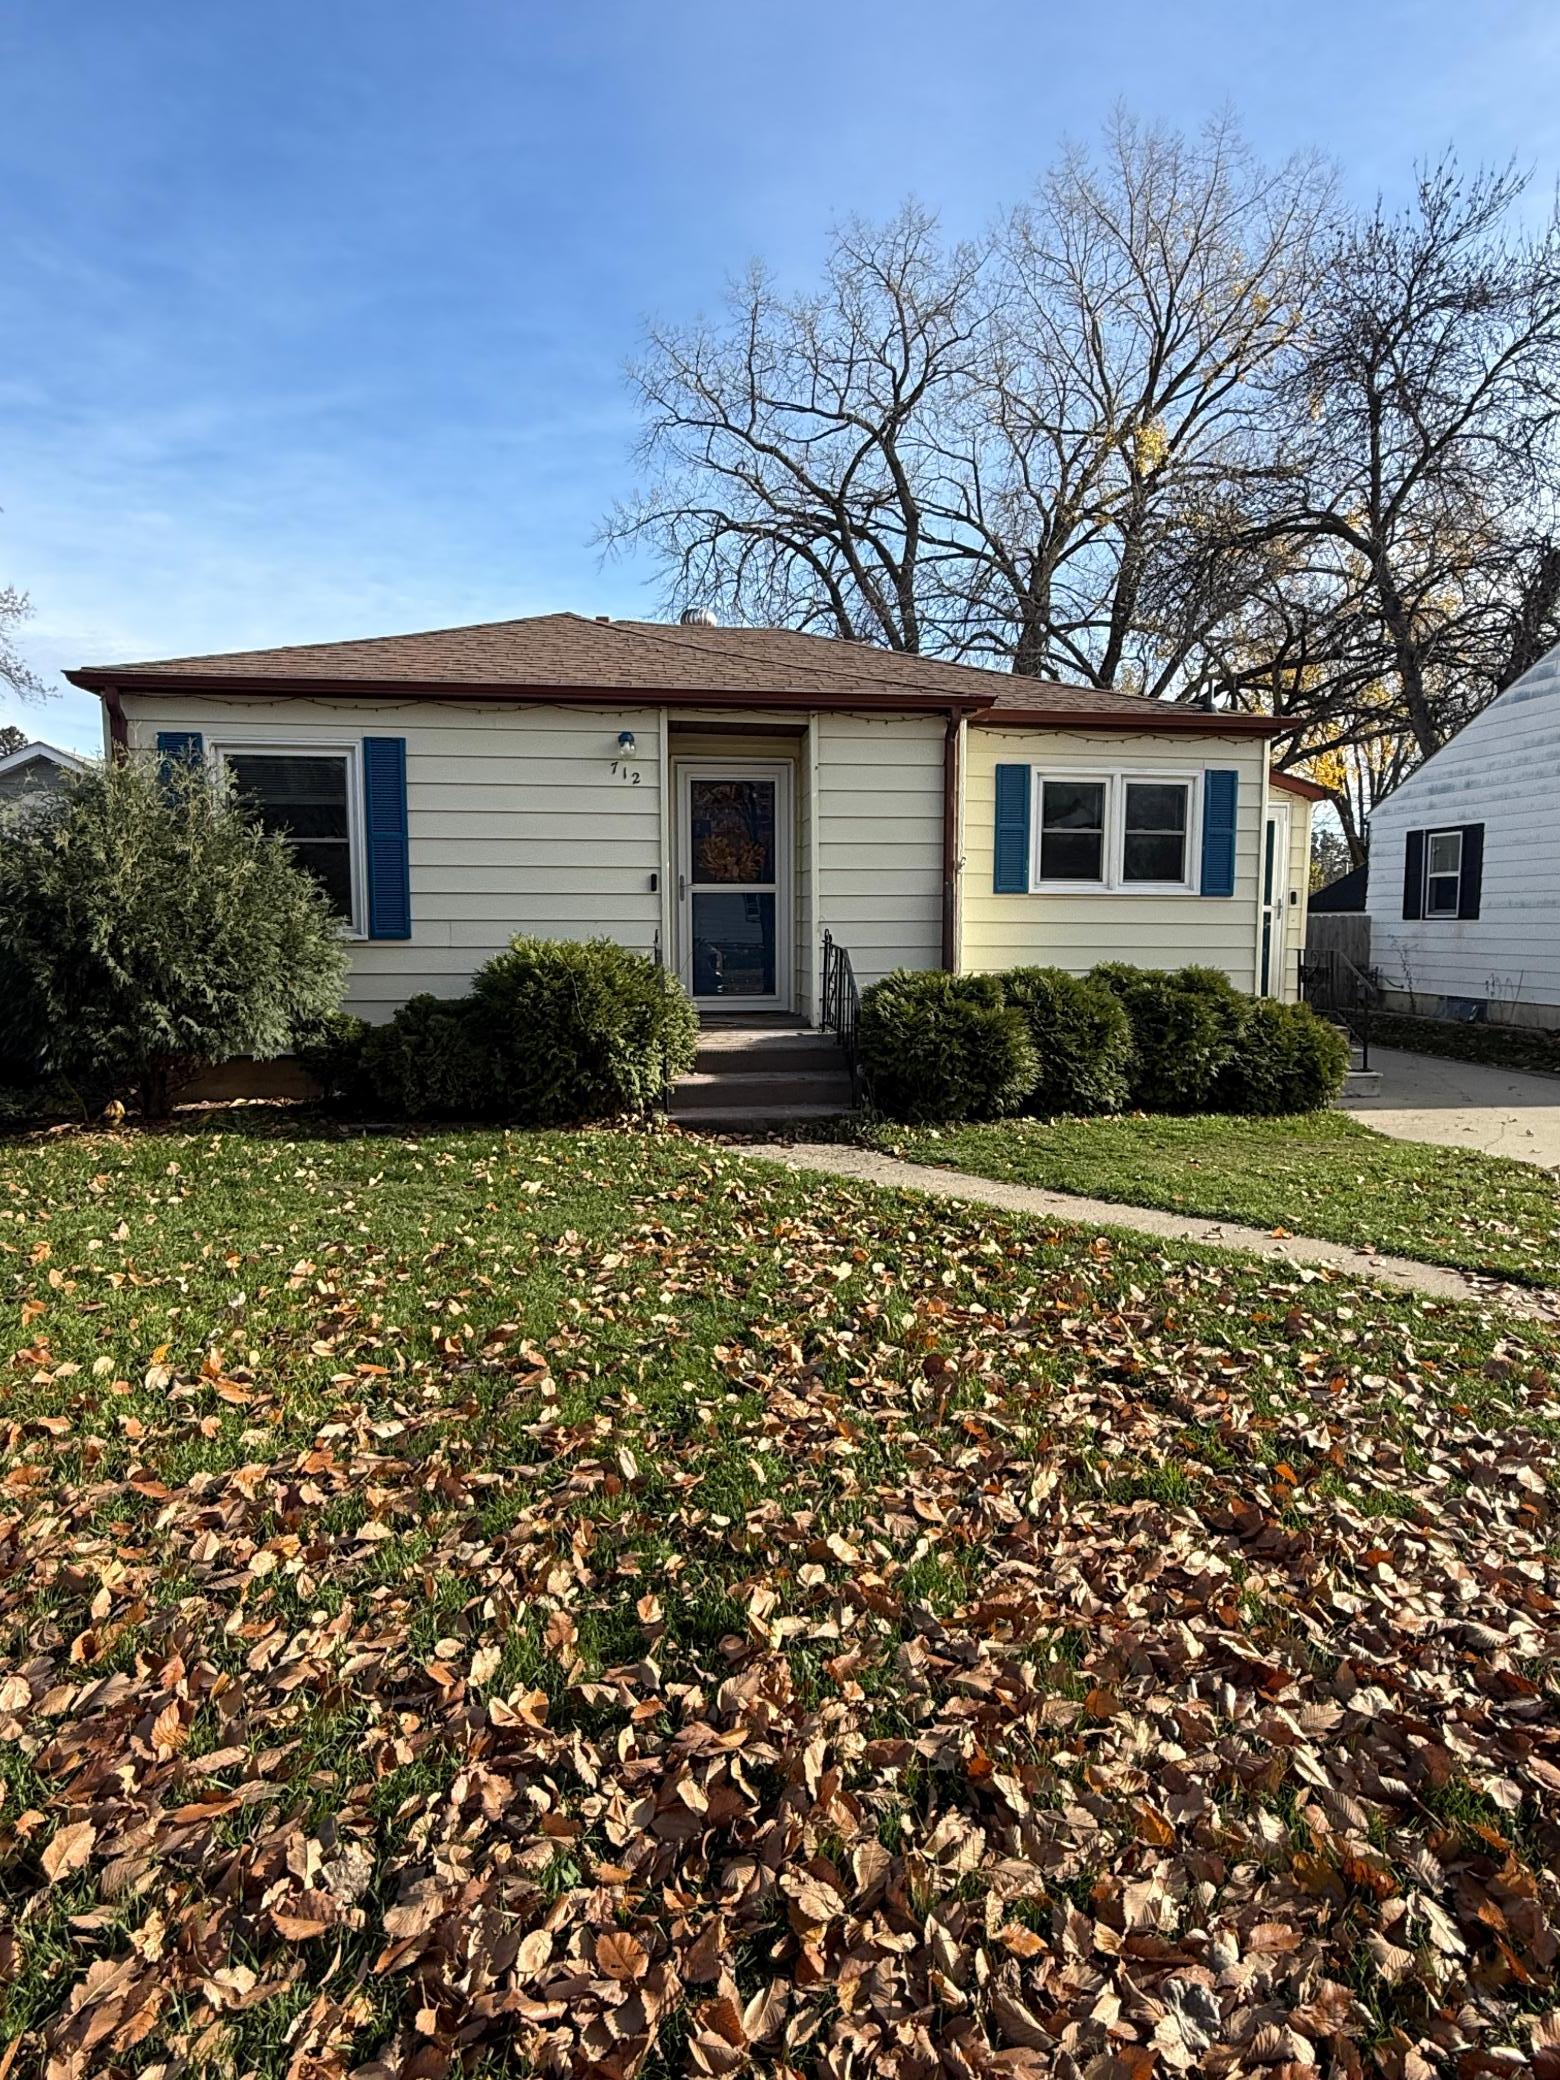 712 16th Street N, Moorhead, MN — $199,000 · Est. $1,085/mo · House for Sale · Rambler · 2 bed · 1 bath · 752 sqft · 0.17 ac lot · Active · M Premiere · Listed by Better Homes and Gardens Real
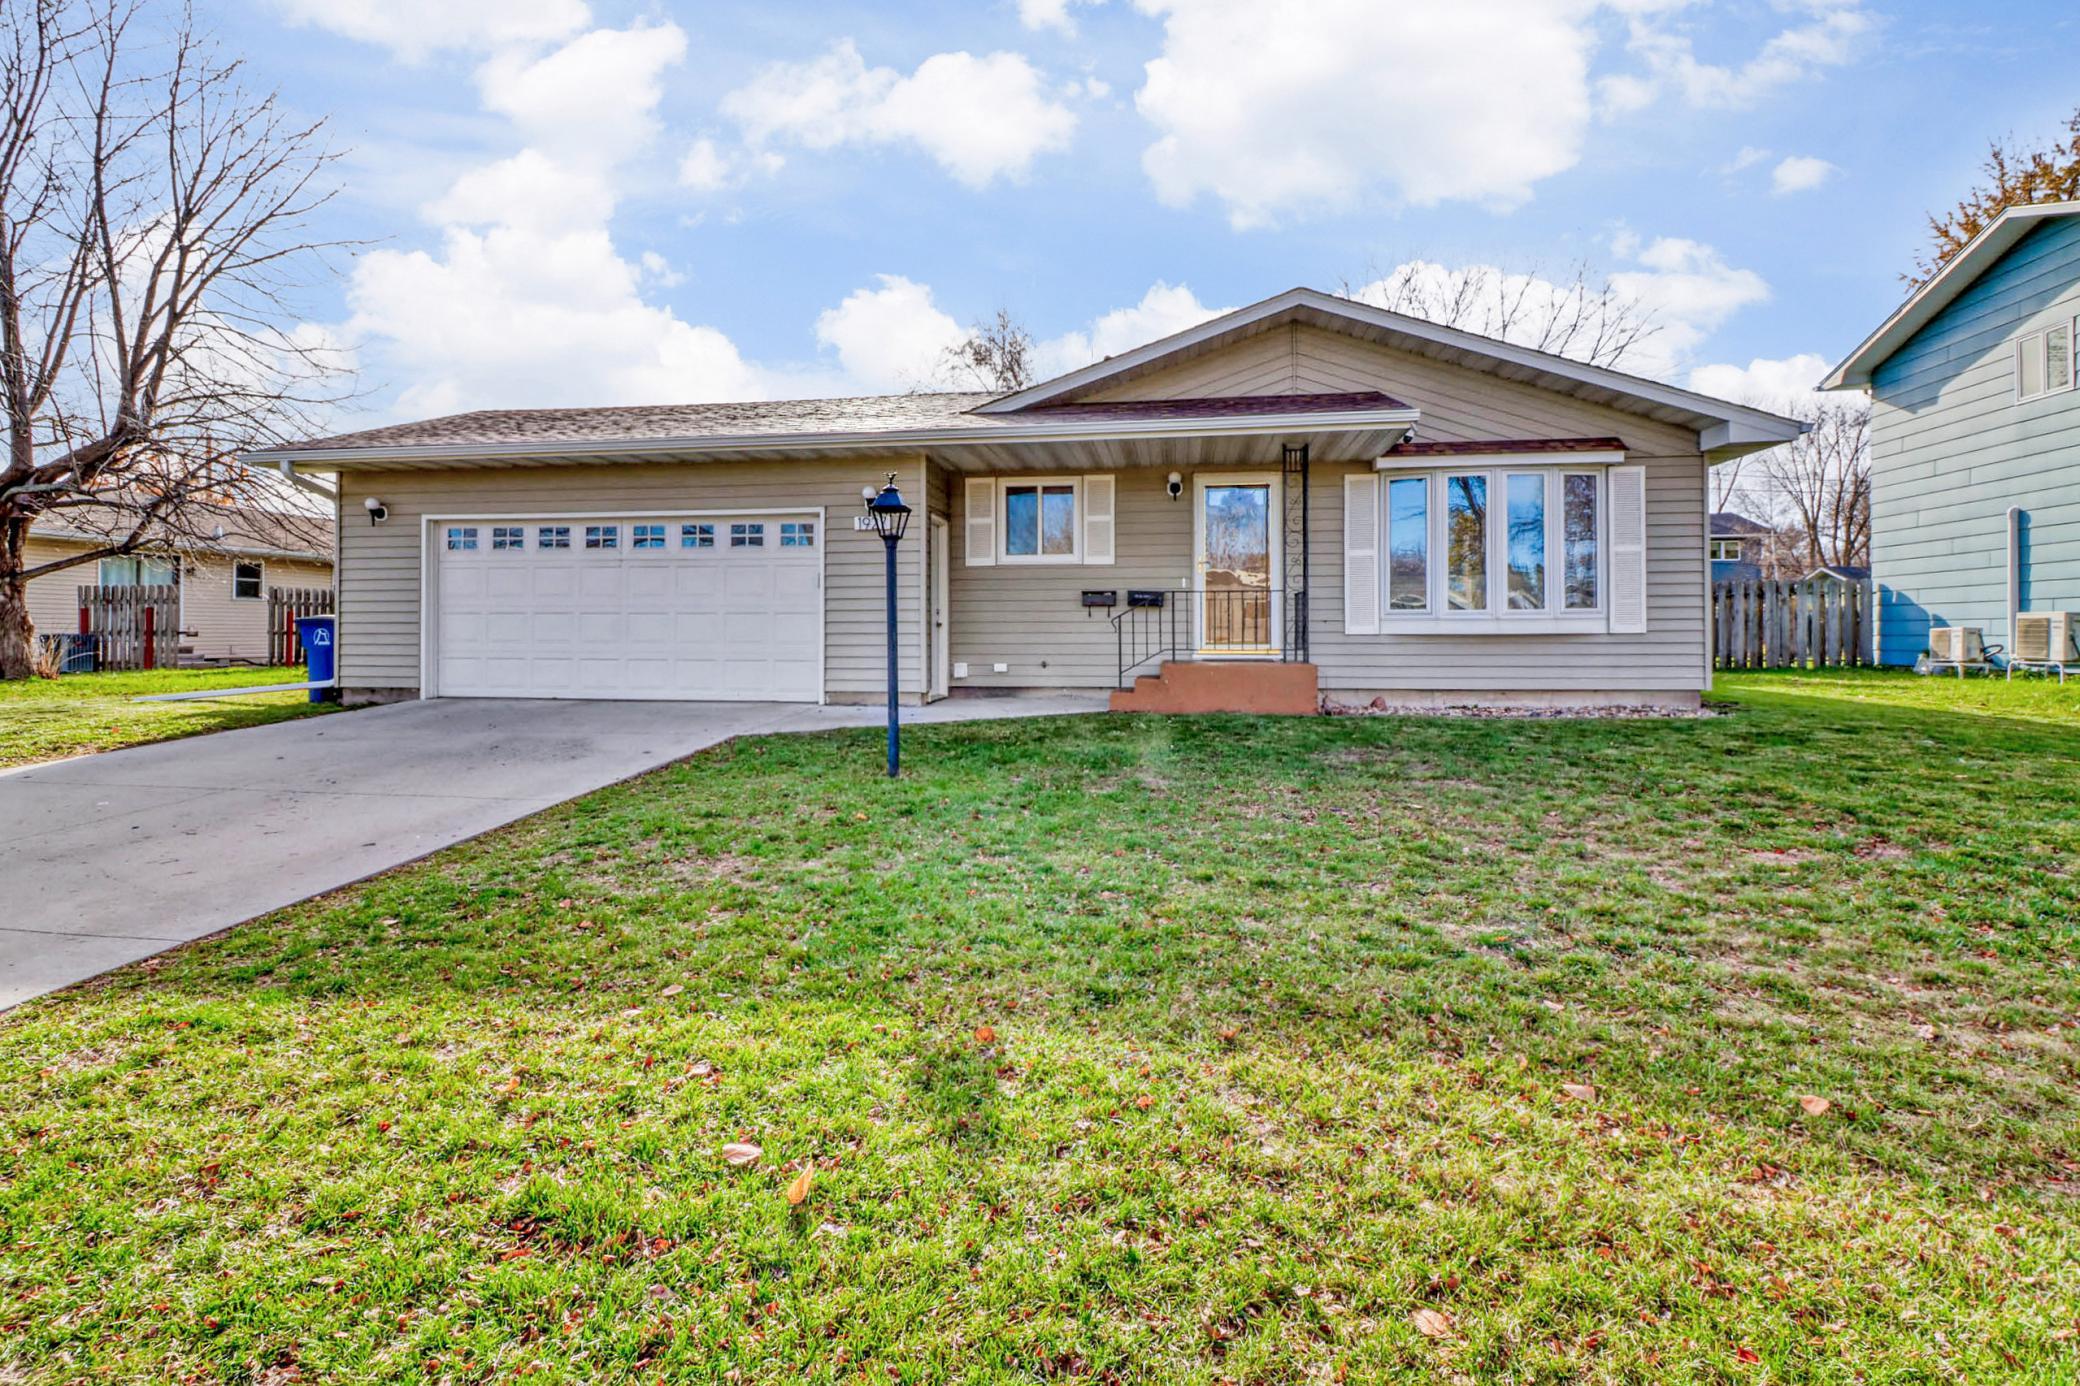 1927 21st Avenue S, Moorhead, MN — $274,900 · Est. $1,499/mo · House for Sale · Rambler · 4 bed · 2 bath · 1,776 sqft · 9,352 sqft lot · Active · M Premiere · Listed by Kvamme Real Estate
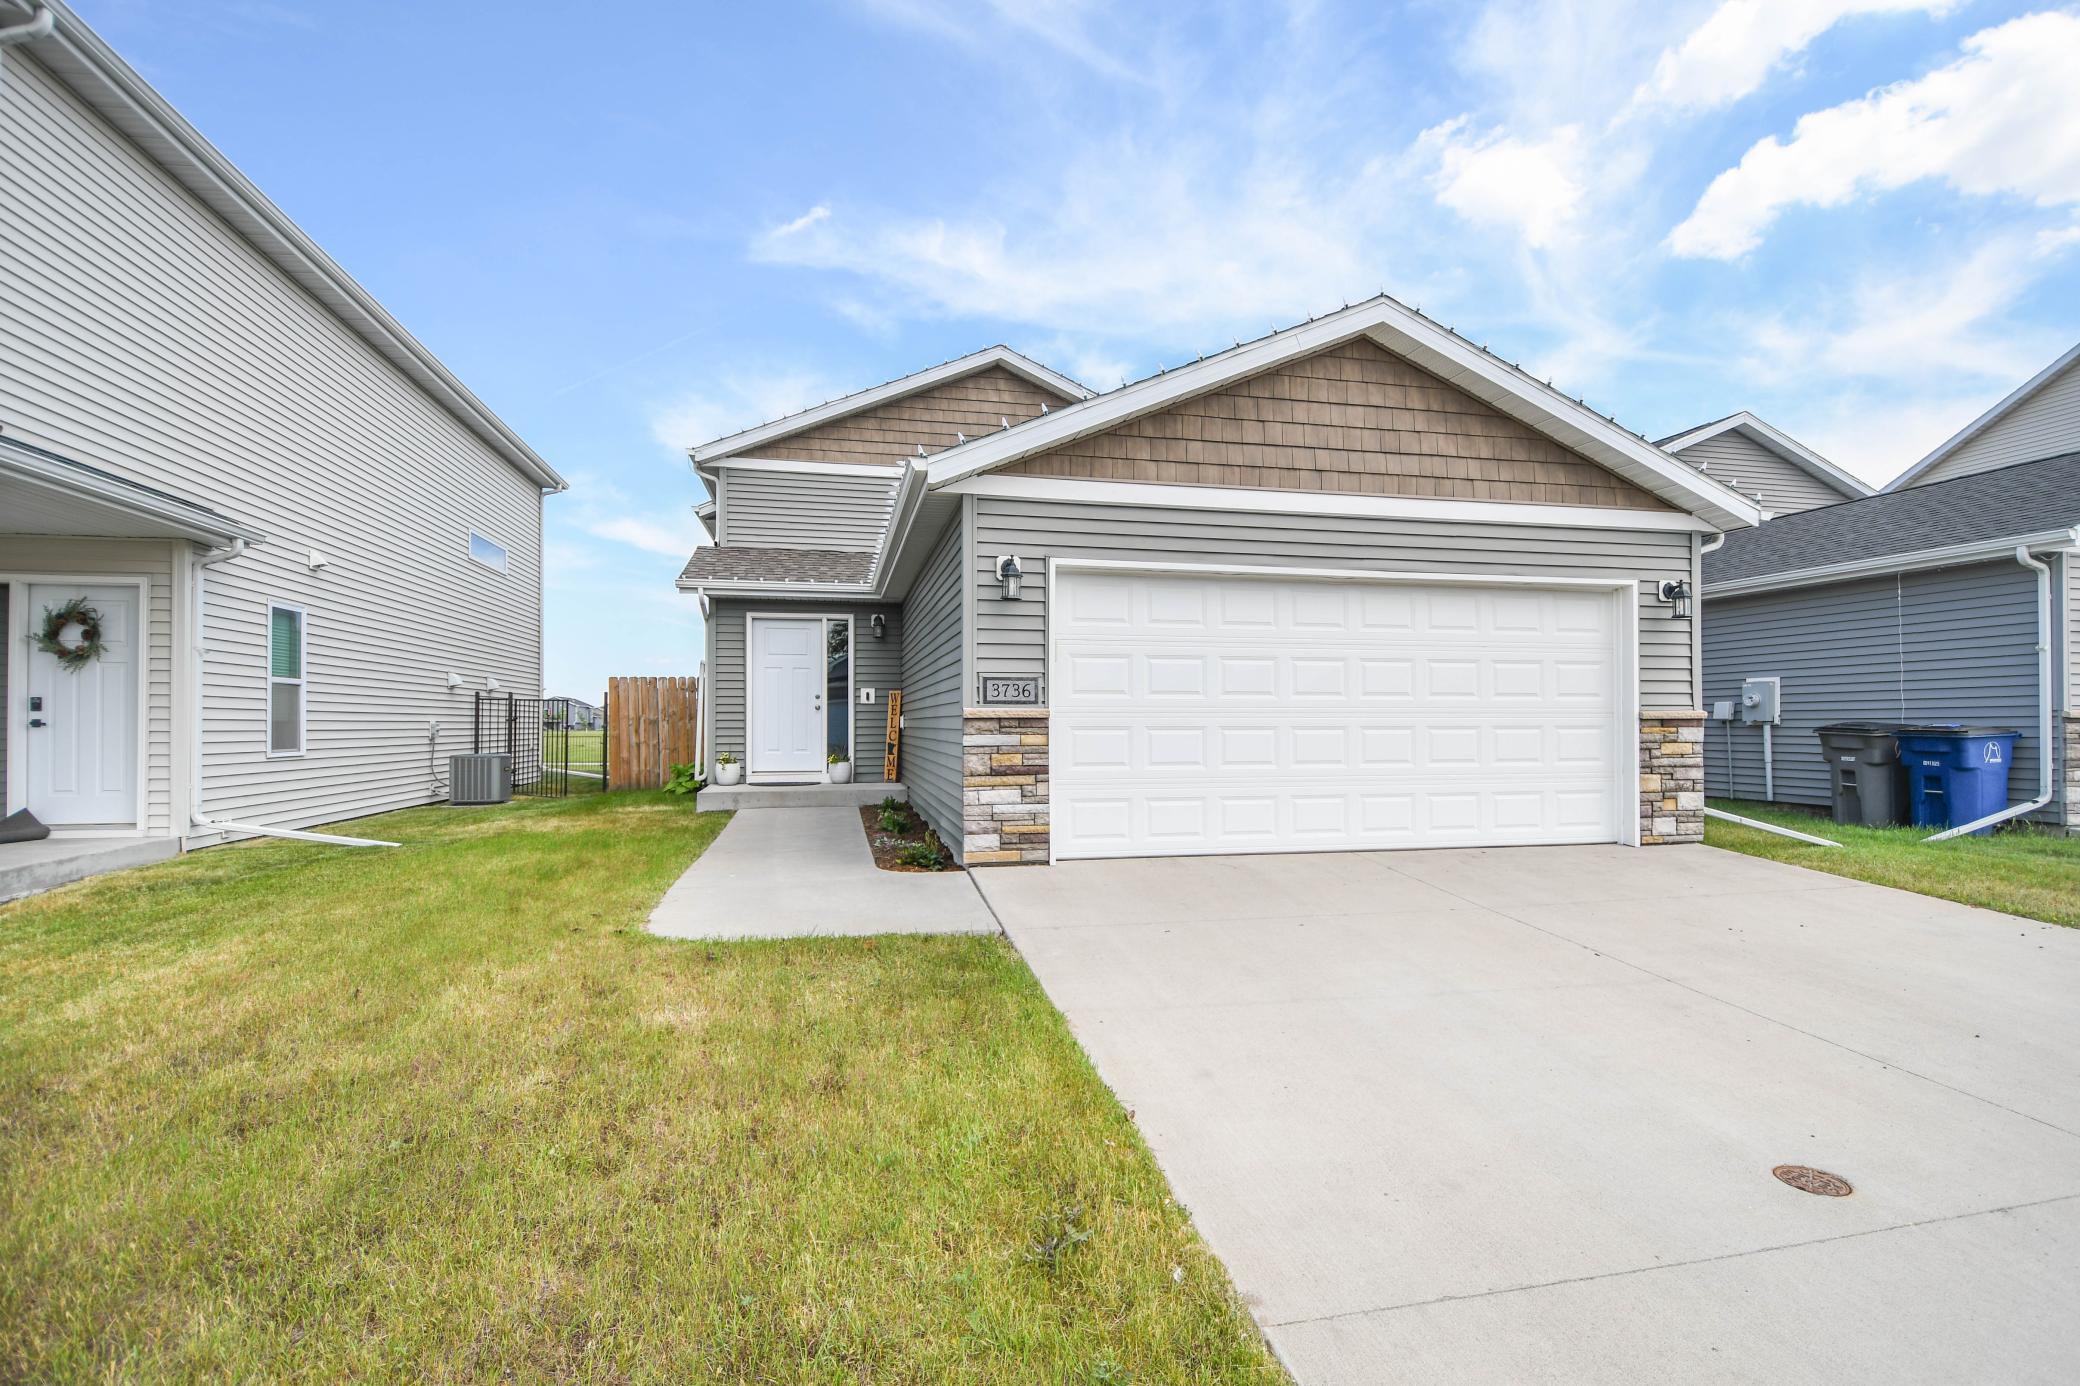 3736 30th Street S, Moorhead, MN — $305,000 · Est. $1,663/mo · House for Sale · Bi-Level · 3 bed · 2 bath · 2,052 sqft · 0.13 ac lot · Active · M Premiere · Listed by FpG Realty
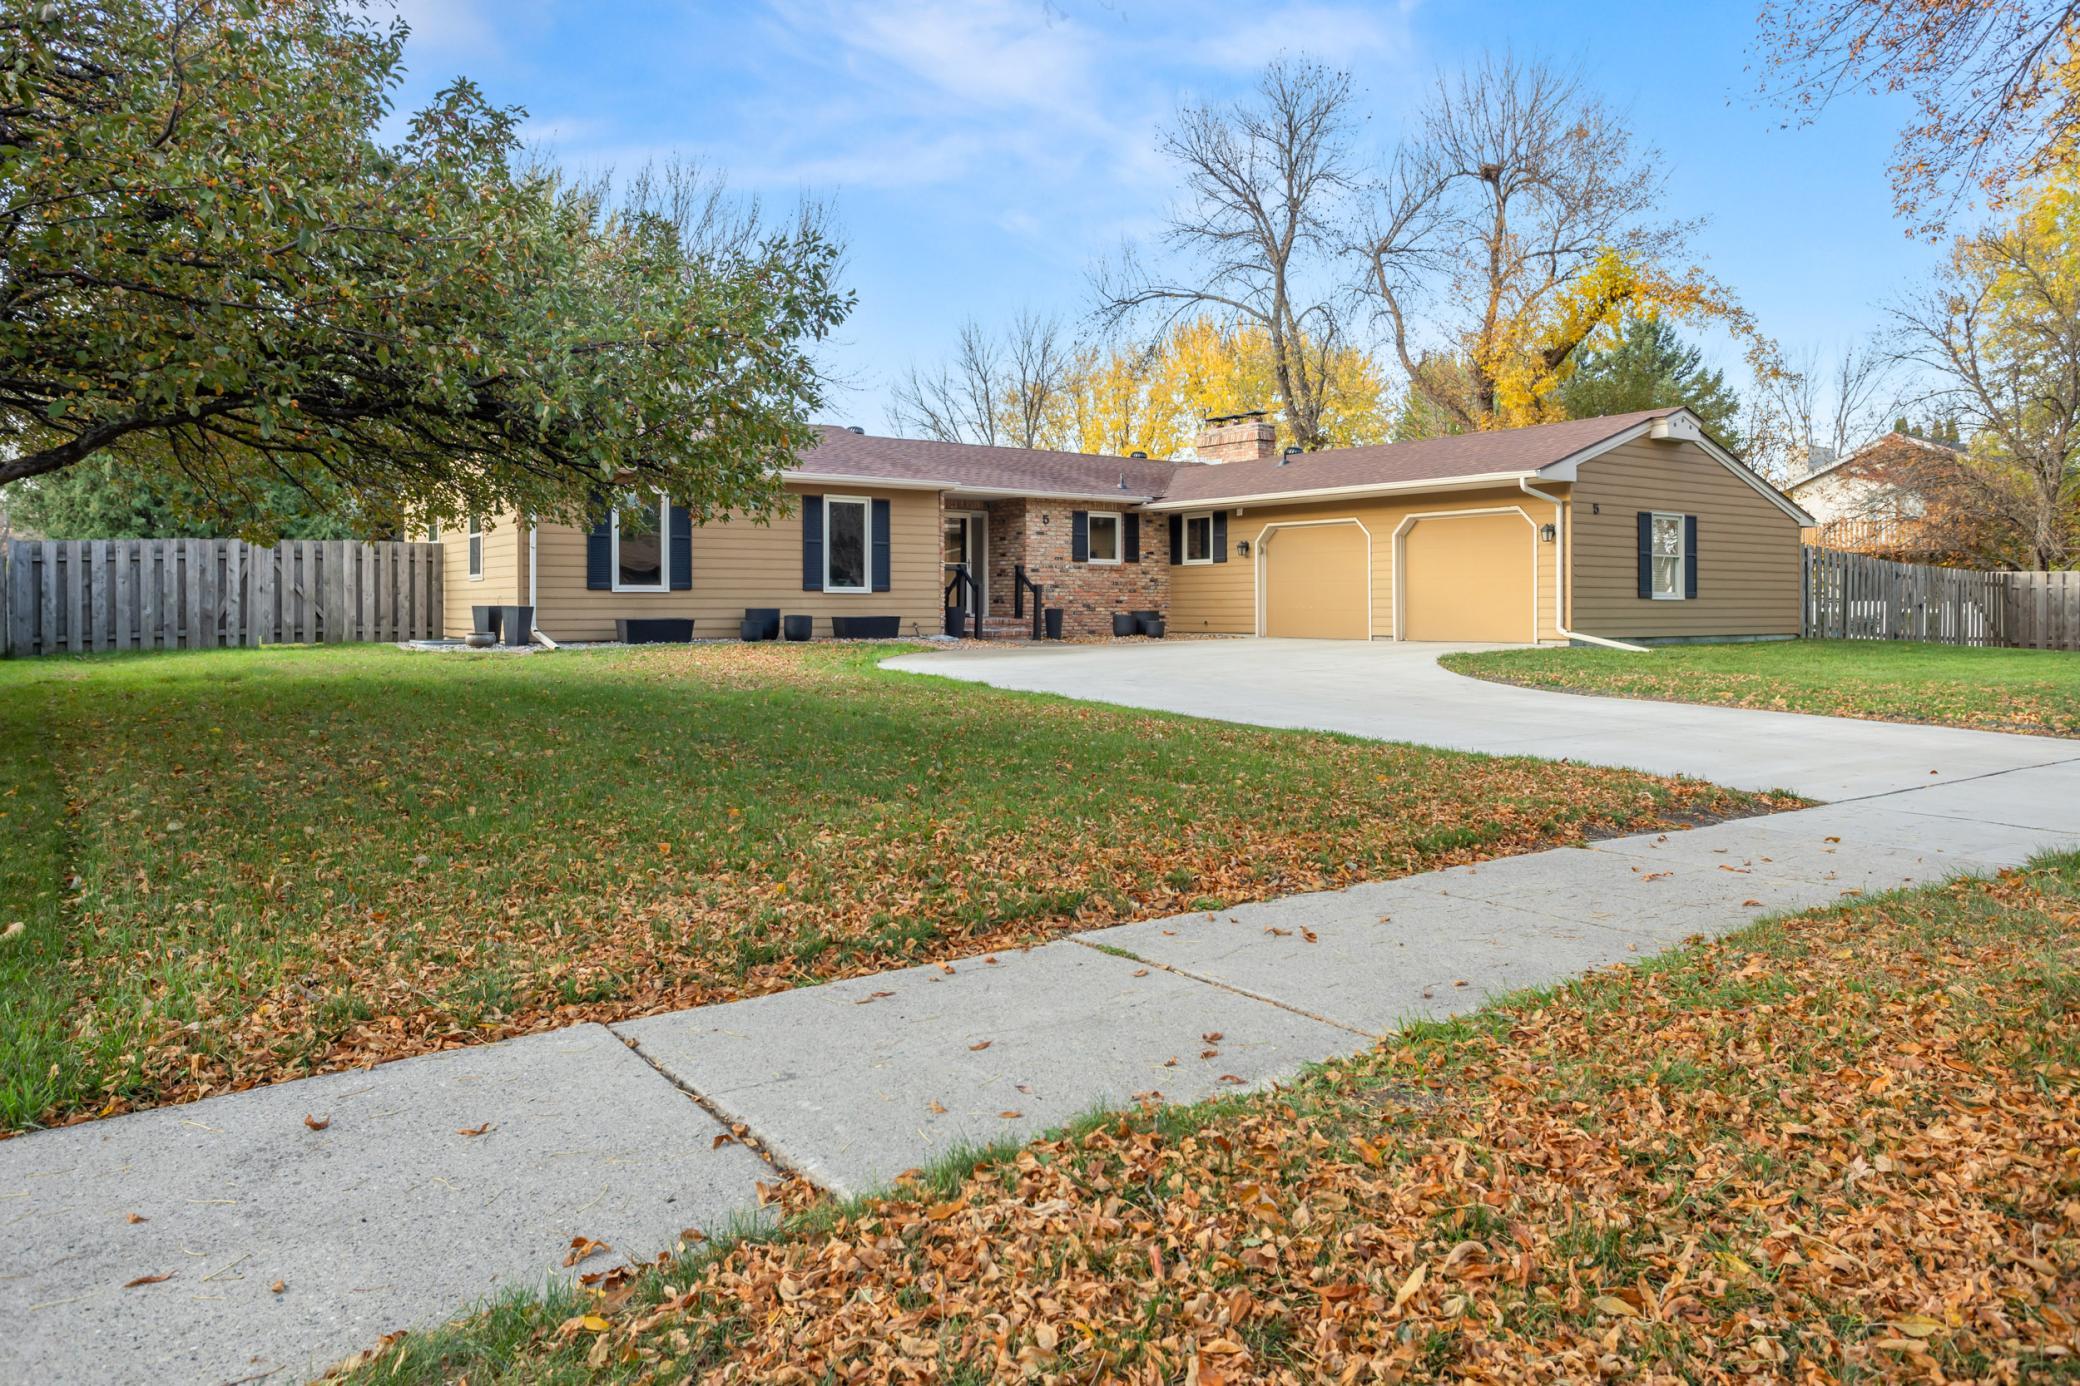 5 37th Avenue S, Moorhead, MN — $425,000 · Est. $2,317/mo · House for Sale · Rambler · 4 bed · 3 bath · 2,908 sqft · 12,879 sqft lot · Active · M Premiere · Listed by Aspire Realty
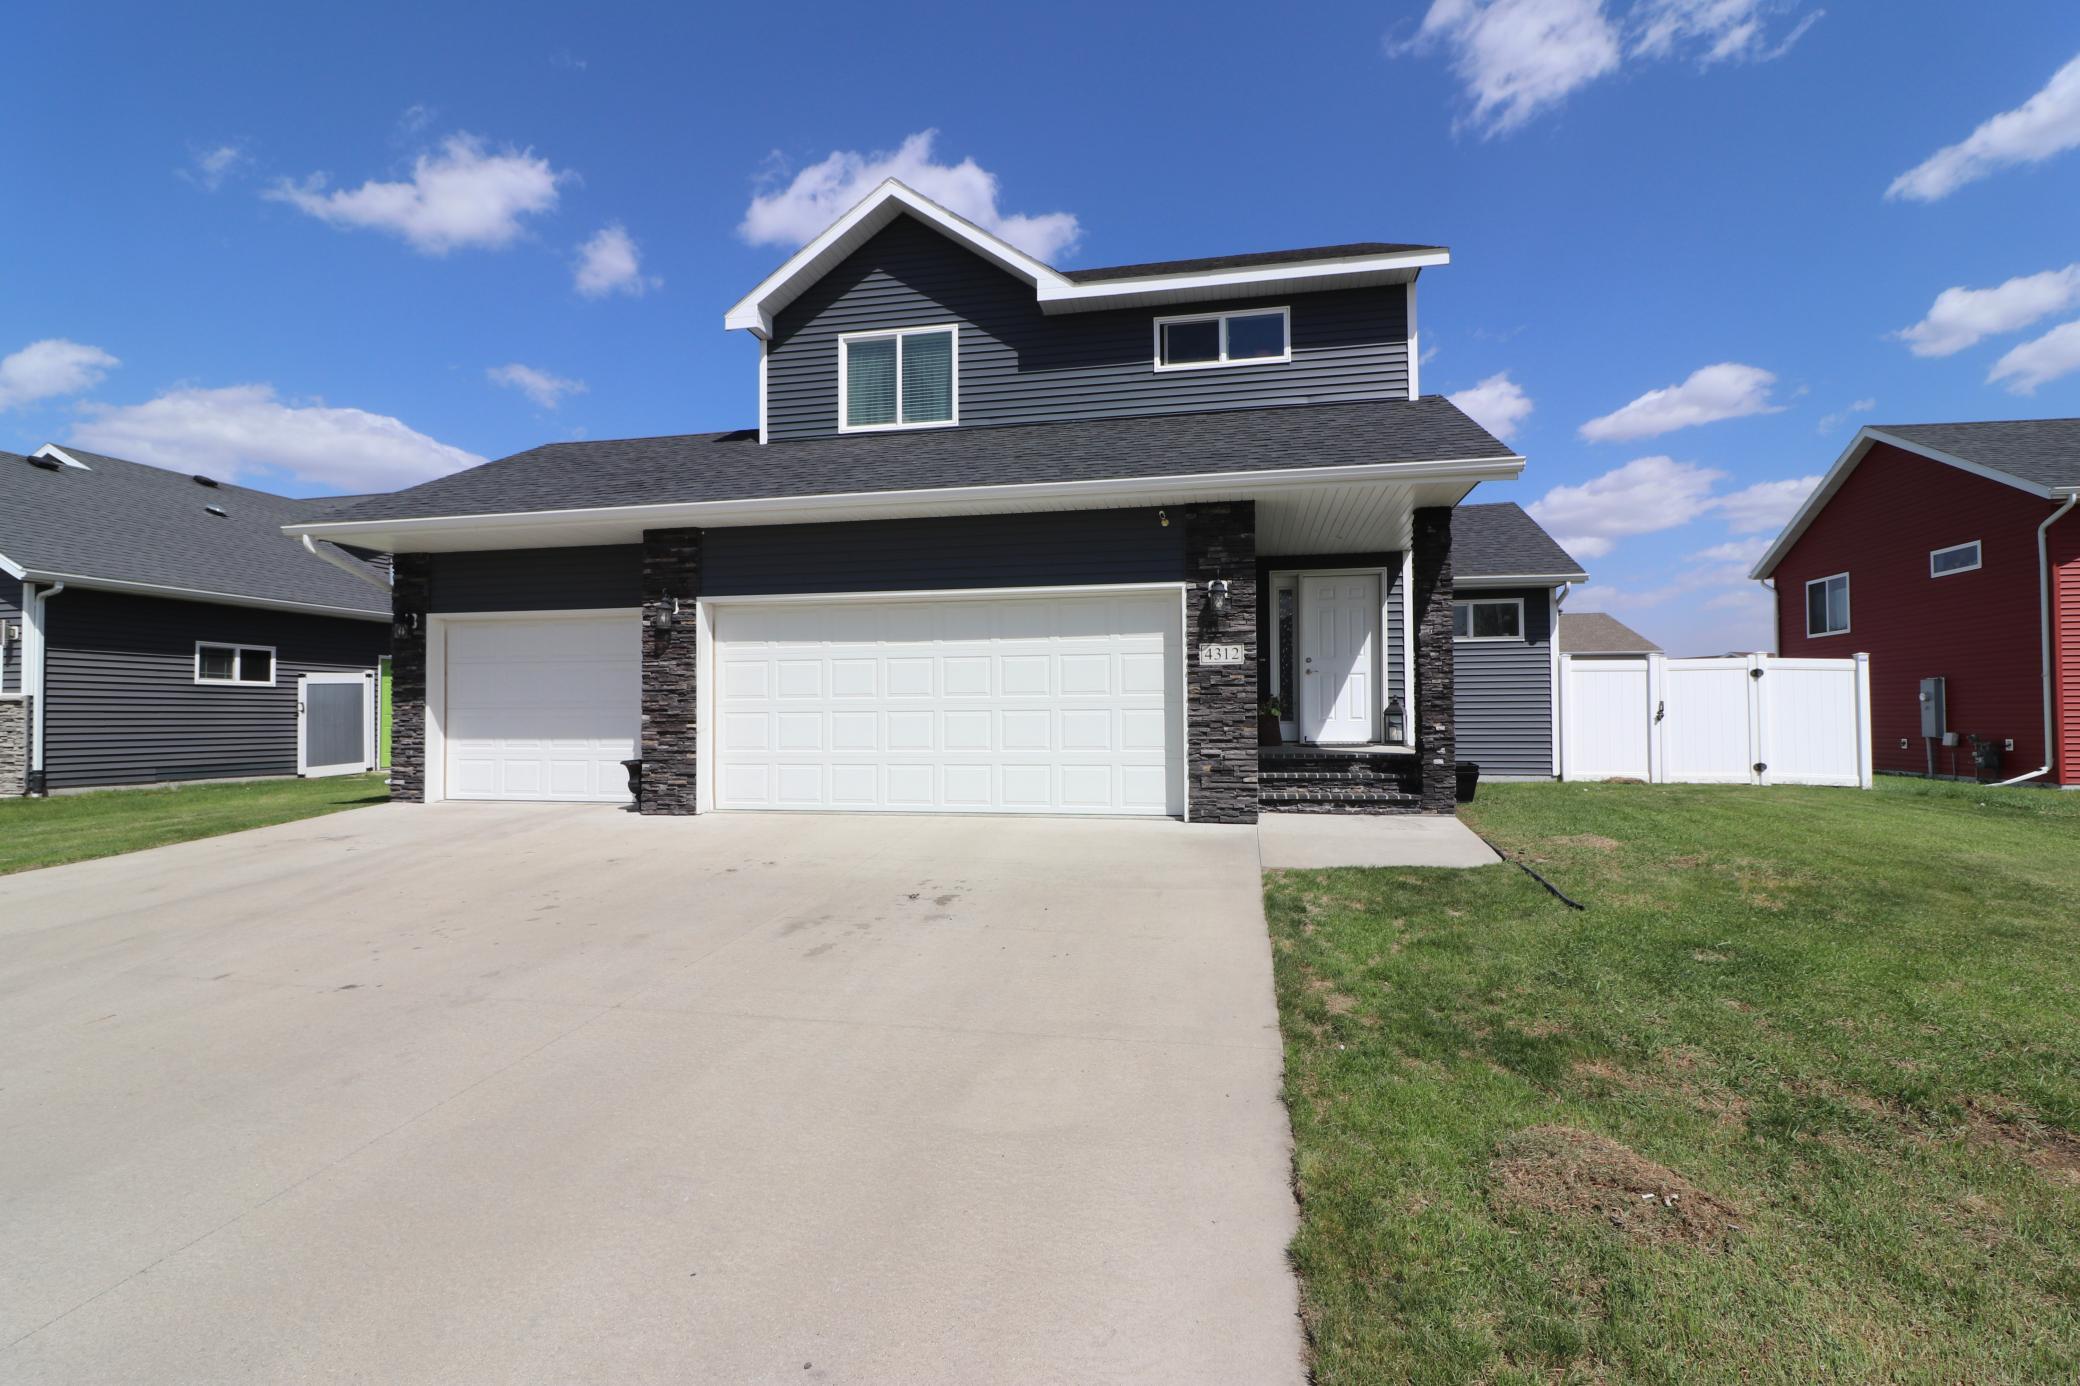 4312 10th Street S, Moorhead, MN — $389,900 · Est. $2,126/mo · House for Sale · Two Story · 4 bed · 4 bath · 2,649 sqft · 9,750 sqft lot · Active · M Premiere · Listed by Trilogy Real Estate
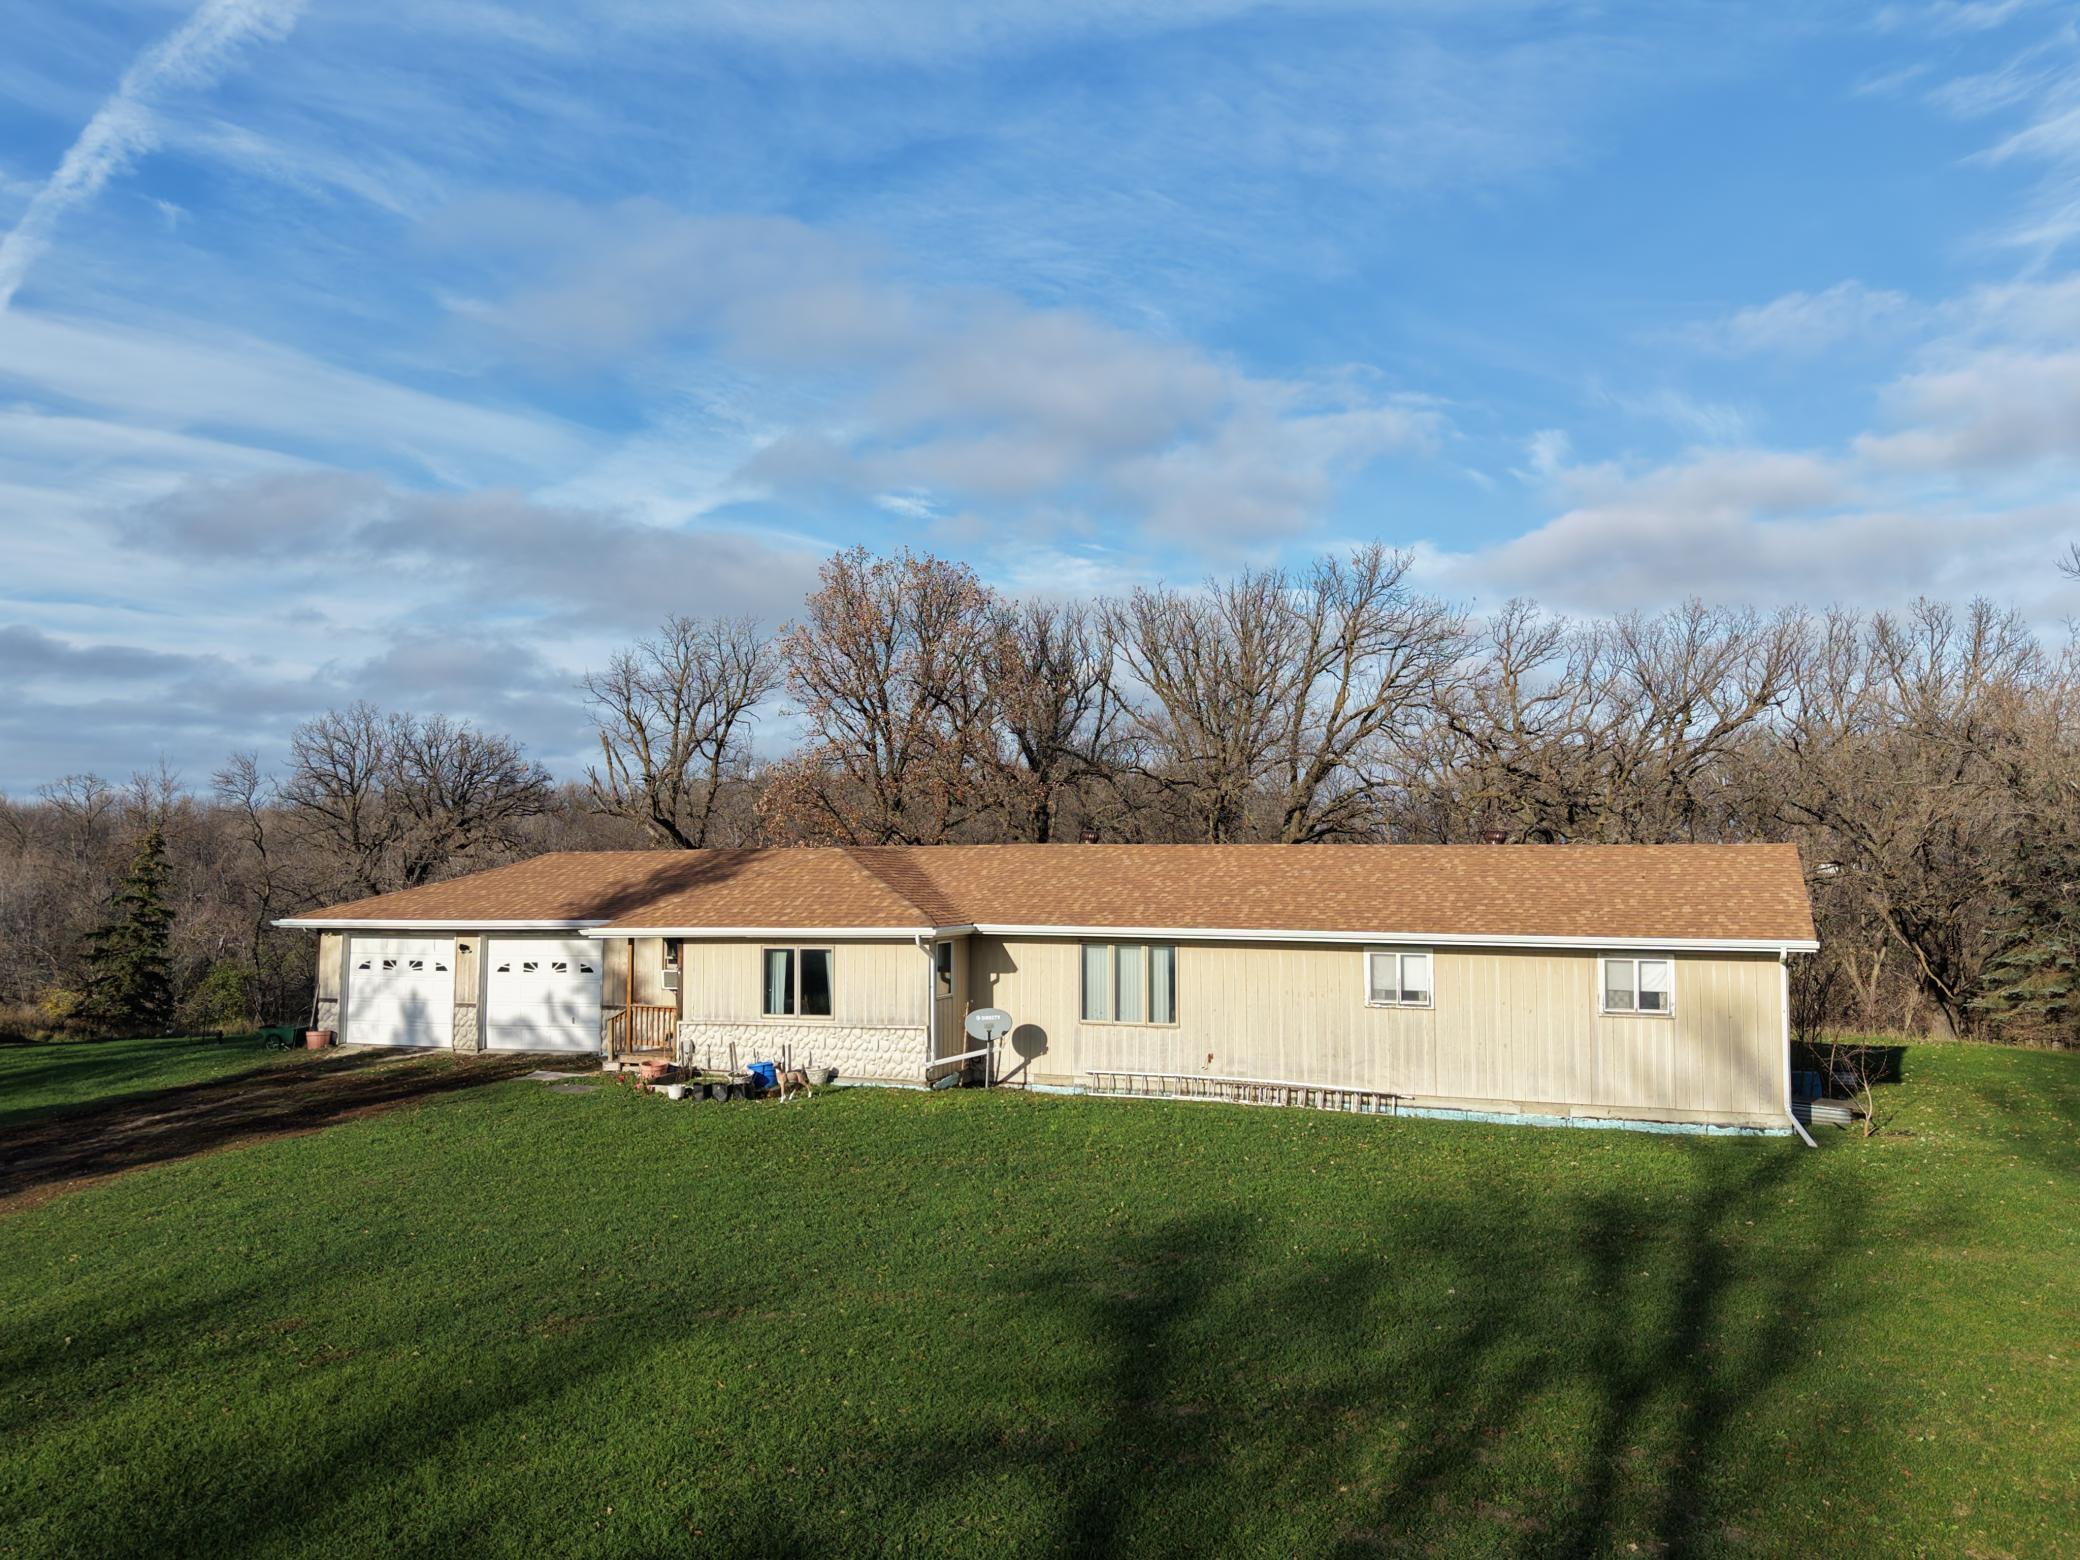 1318 County Highway 25, Hendrum, MN — $349,900 · Est. $1,908/mo · House for Sale · Rambler · Waterfront · Acreage · 3 bed · 2 bath · 1,916 sqft · 54.5 ac lot · ~35 min from Fargo · Active · M Premiere · Listed by Home Crown Realty LLC
See all 2,590 homes for sale in Minnesota
More Minnesota Real Estate
- Homes for Sale in Minnesota
- Just Listed in Minnesota
- Price Reduced in Minnesota
- Minnesota Lake Homes
- Minnesota Lake Home Market
What’s Your Minnesota Home Worth?
Get a free home value built on recent sales near you, from a local REALTOR® who knows these numbers.
Minnesota Housing Market FAQs
Is Minnesota a buyer's or seller's market right now?
Northwest and central Minnesota is a seller’s market, just barely, with 3.8 months of supply in the report run November 2, 2026: 2,690 homes for sale against 2,120 sold from August through October 2026 (NorthstarMLS). Across all of Minnesota, 19,379 homes were for sale in September 2026, and 38% had a price cut (Realtor.com). Under 4 months is a seller’s market, 4 to 6 months is balanced, and over 6 months is a buyer’s market.
What is the median home price in Minnesota?
Across Minnesota, the median list price was $379,900 in September 2026, down 2.3% from a year earlier (Realtor.com). In northwest and central Minnesota, homes sold through NorthstarMLS for a median $310,000 from August through October 2026, about the same as a year earlier. The average sale price was $405,446; a few expensive homes pull it above the median.
Are home prices going up in Minnesota?
Yes. By FHFA’s house price index, Minnesota home values were up 3.0% over the year to the second quarter of 2026 and up 31.2% over five years. In northwest and central Minnesota, the median sale price was $310,000 from August through October 2026, about level with the same months a year earlier ($310,500).
How many homes are for sale in Minnesota?
19,379 homes were listed for sale across Minnesota in September 2026, up 30.0% from a year earlier, with 7,746 new listings that month and 6,162 pending (Realtor.com).
How fast do homes sell in Minnesota?
Across Minnesota, the homes for sale had been on the market a median 47 days in September 2026 (45 a year earlier). In northwest and central Minnesota, homes that sold from August through October 2026 spent a median 44 days on the market, and 21% sold for more than the asking price.
Where can I find reliable, up-to-date housing market data for Minnesota?
Here. Every month this report adds up northwest and central Minnesota home sales from NorthstarMLS (the latest three months, against the same months a year earlier) and whole-state listing data from Realtor.com and home values from FHFA. Each number says which months it covers, and the top of the page says when the report last ran.
How often is this Minnesota housing market report updated?
Once a month. On the second Sunday of each month we take the last three full months of NorthstarMLS closings, compare them with the same months a year earlier, and count the homes for sale that day. The whole-state listing and home-value figures are read weekly from FRED and enter the report each month.
Source: NorthstarMLS closed sales and listings, as distributed by MLS Grid. Months of supply: homes for sale divided by the last three months of sales, times three. Whole-state figures: Realtor.com listing data and the FHFA House Price Index, via FRED, Federal Reserve Bank of St. Louis.
 Listings courtesy of NorthstarMLS as distributed by MLS GRID
Based on information submitted to the MLS GRID as of 11/12/2026, 1:19 PM CST. All data is obtained from various sources and may not have been verified by broker or MLS GRID. Supplied Open House Information is subject to change without notice. All information should be independently reviewed and verified for accuracy. Properties may or may not be listed by the office/agent presenting the information.
IDX information is provided exclusively for consumers' personal, non-commercial use and may not be used for any purpose other than to identify prospective properties consumers may be interested in purchasing.
Modern Market REALTORS® — Jim Christl (Broker) & Shannon Barnum (Associate Broker). Serving Fargo, Moorhead, West Fargo, Horace, Detroit Lakes, and Minnesota lake country. Call (701) 205-5517.